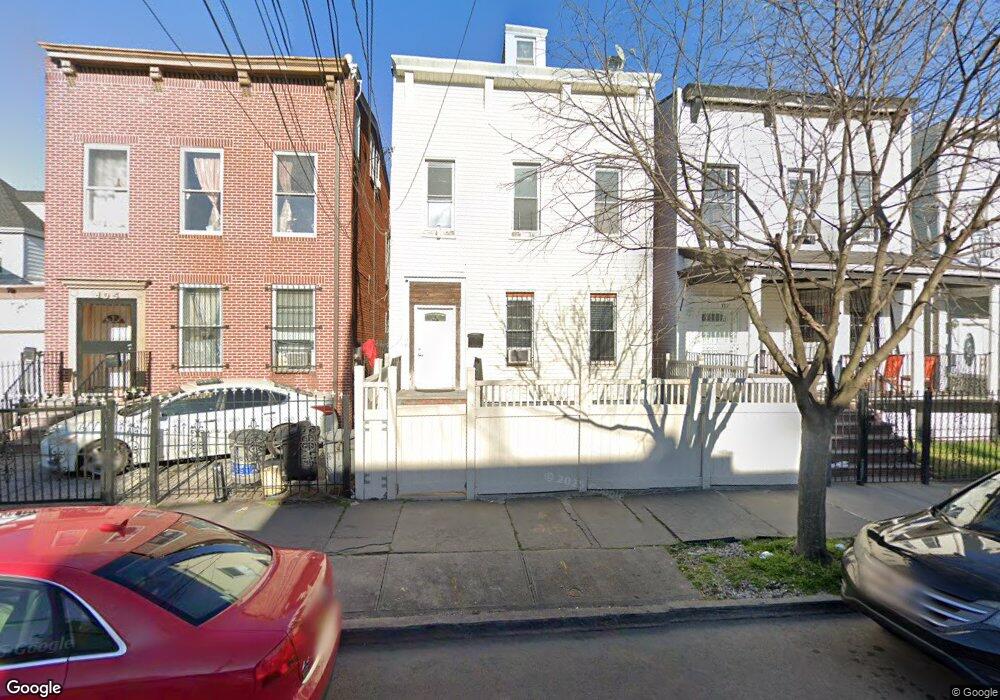
109 Ashford St Brooklyn, NY 11207
Cypress Hills NeighborhoodEstimated Value: $712,000 - $829,000
--
Bed
--
Bath
1,636
Sq Ft
$474/Sq Ft
Est. Value
About This Home
This home is located at 109 Ashford St, Brooklyn, NY 11207 and is currently estimated at $775,315, approximately $473 per square foot. 109 Ashford St is a home located in Kings County with nearby schools including P.S. 108 - Sal Abbracciamento, Liberty Avenue Middle School, and Vista Academy.
Ownership History
Date
Name
Owned For
Owner Type
Purchase Details
Closed on
Jun 25, 2003
Sold by
Delos Santos Alberto and De Los Santos
Bought by
Delos Santos Alberto and De Los Santos
Current Estimated Value
Purchase Details
Closed on
Oct 30, 1997
Sold by
Basic Management Corp
Bought by
Delossantos Elva and Delossantos Johanna
Home Financials for this Owner
Home Financials are based on the most recent Mortgage that was taken out on this home.
Original Mortgage
$174,500
Interest Rate
7.14%
Mortgage Type
FHA
Purchase Details
Closed on
Mar 24, 1997
Sold by
Fiorino Frances
Bought by
Basic Management Corp
Create a Home Valuation Report for This Property
The Home Valuation Report is an in-depth analysis detailing your home's value as well as a comparison with similar homes in the area
Home Values in the Area
Average Home Value in this Area
Purchase History
| Date | Buyer | Sale Price | Title Company |
|---|---|---|---|
| Delos Santos Alberto | -- | -- | |
| Delos Santos Alberto | -- | -- | |
| Delossantos Elva | $175,000 | Stewart Title Insurance Co | |
| Delossantos Elva | $175,000 | Stewart Title Insurance Co | |
| Basic Management Corp | $92,000 | Security Title & Guaranty Co | |
| Basic Management Corp | $92,000 | Security Title & Guaranty Co |
Source: Public Records
Mortgage History
| Date | Status | Borrower | Loan Amount |
|---|---|---|---|
| Previous Owner | Delossantos Elva | $174,500 | |
| Closed | Delos Santos Alberto | $0 |
Source: Public Records
Tax History Compared to Growth
Tax History
| Year | Tax Paid | Tax Assessment Tax Assessment Total Assessment is a certain percentage of the fair market value that is determined by local assessors to be the total taxable value of land and additions on the property. | Land | Improvement |
|---|---|---|---|---|
| 2025 | $4,598 | $51,960 | $12,840 | $39,120 |
| 2024 | $4,598 | $49,860 | $12,840 | $37,020 |
| 2023 | $4,576 | $44,040 | $12,840 | $31,200 |
| 2022 | $4,248 | $41,760 | $12,840 | $28,920 |
| 2021 | $4,230 | $42,300 | $12,840 | $29,460 |
| 2020 | $2,102 | $28,800 | $12,840 | $15,960 |
| 2019 | $3,991 | $28,800 | $12,840 | $15,960 |
| 2018 | $3,828 | $18,778 | $6,259 | $12,519 |
| 2017 | $3,615 | $17,733 | $8,126 | $9,607 |
| 2016 | $3,348 | $16,748 | $7,808 | $8,940 |
| 2015 | $2,018 | $16,744 | $9,720 | $7,024 |
| 2014 | $2,018 | $15,897 | $11,063 | $4,834 |
Source: Public Records
Map
Nearby Homes
- 111 Ashford St
- 105 Ashford St
- 115 Ashford St
- 117 Ashford St
- 224 Arlington Ave
- 218 Arlington Ave
- 204 Cleveland St
- 230 Arlington Ave
- 119 Ashford St
- 206 Cleveland St
- 200 Cleveland St
- 210 Cleveland St
- 212 Cleveland St
- 236 Arlington Ave
- 121 Ashford St
- 216 Arlington Ave
- 110 Ashford St
- 106 Ashford St
- 112 Ashford St
- 238 Arlington Ave