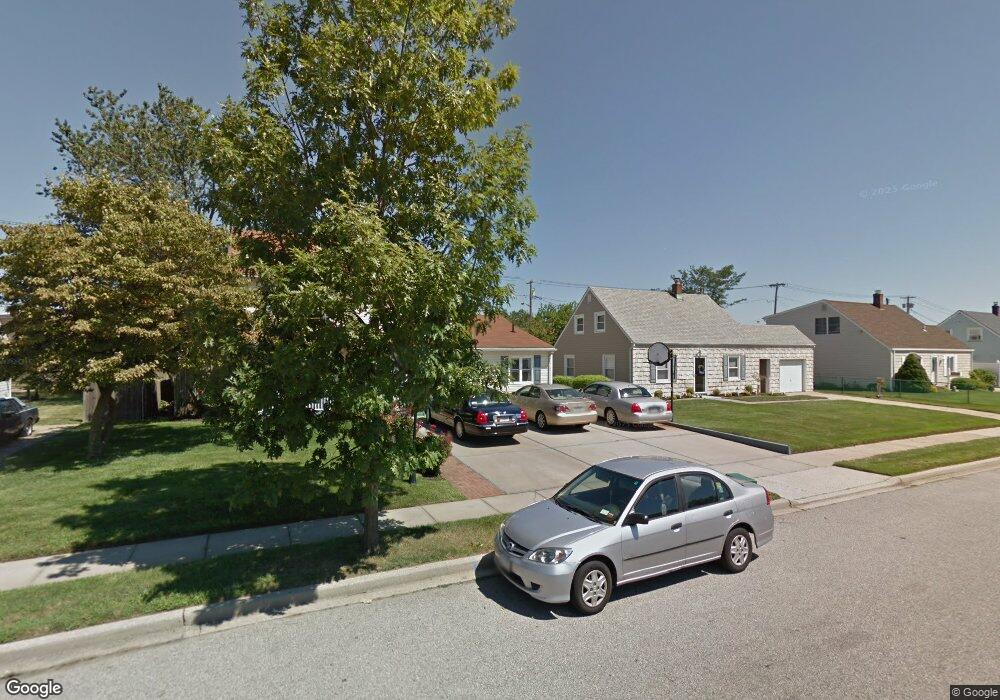
109 Balsam Ln Unit Rear Levittown, NY 11756
Estimated Value: $778,000 - $814,487
1
Bed
2
Baths
2,030
Sq Ft
$392/Sq Ft
Est. Value
About This Home
This home is located at 109 Balsam Ln Unit Rear, Levittown, NY 11756 and is currently estimated at $796,244, approximately $392 per square foot. 109 Balsam Ln Unit Rear is a home located in Nassau County with nearby schools including Michael F. Stokes Elementary School, J Fred Sparke Elementary School, and Island Trees Middle School.
Ownership History
Date
Name
Owned For
Owner Type
Purchase Details
Closed on
Jul 11, 2019
Sold by
Ali Sheikh Zahid and Ali Sundas
Bought by
Mohammed Tuseef and Mohammed Nazil
Current Estimated Value
Home Financials for this Owner
Home Financials are based on the most recent Mortgage that was taken out on this home.
Original Mortgage
$541,500
Outstanding Balance
$474,402
Interest Rate
3.82%
Mortgage Type
New Conventional
Estimated Equity
$321,842
Purchase Details
Closed on
Jun 21, 2016
Sold by
Sheikh Zahid A and Ali Sheikh Zahid
Bought by
Ali Sheikh Zahid and Ali Sundas
Purchase Details
Closed on
Aug 2, 2005
Sold by
Thompson Kenneth
Bought by
Sheikh Zahid
Purchase Details
Closed on
Oct 5, 1995
Sold by
Delvecchio Robert and Delvecchio Rosemary
Bought by
Thomson Kenneth and Thomson Elizabeth
Create a Home Valuation Report for This Property
The Home Valuation Report is an in-depth analysis detailing your home's value as well as a comparison with similar homes in the area
Home Values in the Area
Average Home Value in this Area
Purchase History
| Date | Buyer | Sale Price | Title Company |
|---|---|---|---|
| Mohammed Tuseef | $570,000 | Judicial Title | |
| Ali Sheikh Zahid | -- | None Available | |
| Sheikh Zahid | $439,000 | -- | |
| Thomson Kenneth | $100,000 | -- |
Source: Public Records
Mortgage History
| Date | Status | Borrower | Loan Amount |
|---|---|---|---|
| Open | Mohammed Tuseef | $541,500 |
Source: Public Records
Tax History Compared to Growth
Tax History
| Year | Tax Paid | Tax Assessment Tax Assessment Total Assessment is a certain percentage of the fair market value that is determined by local assessors to be the total taxable value of land and additions on the property. | Land | Improvement |
|---|---|---|---|---|
| 2025 | $12,464 | $510 | $253 | $257 |
| 2024 | $4,235 | $510 | $253 | $257 |
| 2023 | $12,393 | $510 | $253 | $257 |
| 2022 | $12,393 | $510 | $253 | $257 |
| 2021 | $16,923 | $486 | $241 | $245 |
| 2020 | $12,636 | $743 | $520 | $223 |
| 2019 | $4,101 | $743 | $520 | $223 |
| 2018 | $3,968 | $743 | $0 | $0 |
| 2017 | $5,684 | $743 | $520 | $223 |
| 2016 | $9,457 | $743 | $472 | $271 |
| 2015 | $3,480 | $743 | $472 | $271 |
| 2014 | $3,480 | $743 | $472 | $271 |
| 2013 | $3,523 | $818 | $520 | $298 |
Source: Public Records
Map
Nearby Homes