Estimated Value: $147,089 - $202,000
--
Bed
--
Bath
1,050
Sq Ft
$175/Sq Ft
Est. Value
About This Home
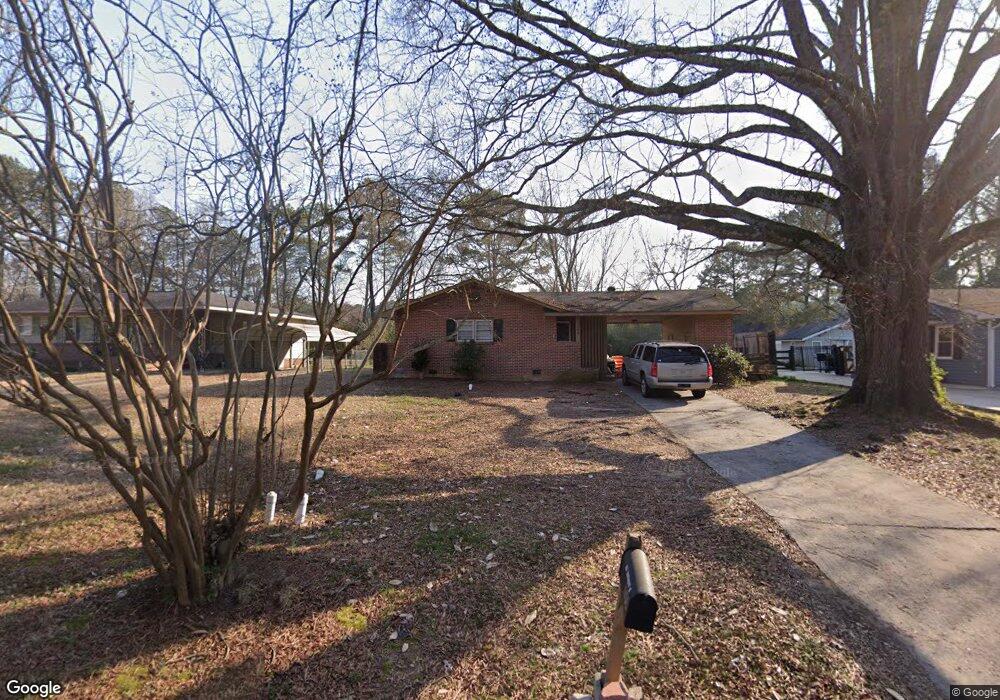
This home is located at 109 Beech Creek Dr NW, Rome, GA 30165 and is currently estimated at $184,022, approximately $175 per square foot. 109 Beech Creek Dr NW is a home located in Floyd County with nearby schools including Coosa Middle School and Coosa High School.
Ownership History
Date
Name
Owned For
Owner Type
Purchase Details
Closed on
Aug 20, 2004
Sold by
Hall Michelle Renae
Bought by
Woodard Terry W and Woodar Michelle R
Current Estimated Value
Purchase Details
Closed on
Nov 24, 1997
Sold by
Hall Franklin Todd and Michelle Renae Hall
Bought by
Hall Michelle Renae
Purchase Details
Closed on
Apr 14, 1995
Sold by
P\R
Bought by
Hall Franklin Todd and Michelle Renae
Purchase Details
Closed on
Apr 15, 1980
Sold by
Justice David Lee and Justice Diane P
Bought by
P\R
Purchase Details
Closed on
Mar 7, 1980
Sold by
Smith Machael G
Bought by
Justice David Lee and Justice Diane P
Purchase Details
Closed on
Sep 30, 1977
Sold by
Turner Bernie O Neal
Bought by
Smith Machael G
Purchase Details
Closed on
Feb 9, 1973
Sold by
Bloodworth James B
Bought by
Turner Bernie O Neal
Purchase Details
Closed on
Jan 31, 1963
Sold by
Lewis E W
Bought by
Bloodworth James B
Purchase Details
Closed on
Jan 1, 1962
Sold by
Beech Creek Homes Inc
Bought by
Lewis E W
Purchase Details
Closed on
Jan 1, 1901
Bought by
Beech Creek Homes Inc
Create a Home Valuation Report for This Property
The Home Valuation Report is an in-depth analysis detailing your home's value as well as a comparison with similar homes in the area
Home Values in the Area
Average Home Value in this Area
Purchase History
| Date | Buyer | Sale Price | Title Company |
|---|---|---|---|
| Woodard Terry W | -- | -- | |
| Hall Michelle Renae | -- | -- | |
| Hall Franklin Todd | $53,000 | -- | |
| P\R | $31,500 | -- | |
| Justice David Lee | -- | -- | |
| Smith Machael G | $25,500 | -- | |
| Turner Bernie O Neal | $21,000 | -- | |
| Bloodworth James B | -- | -- | |
| Lewis E W | -- | -- | |
| Beech Creek Homes Inc | -- | -- |
Source: Public Records
Tax History Compared to Growth
Tax History
| Year | Tax Paid | Tax Assessment Tax Assessment Total Assessment is a certain percentage of the fair market value that is determined by local assessors to be the total taxable value of land and additions on the property. | Land | Improvement |
|---|---|---|---|---|
| 2024 | $1,904 | $51,516 | $5,766 | $45,750 |
| 2023 | $1,524 | $48,930 | $5,088 | $43,842 |
| 2022 | $1,159 | $37,332 | $4,070 | $33,262 |
| 2021 | $1,013 | $31,916 | $4,070 | $27,846 |
| 2020 | $939 | $29,309 | $3,053 | $26,256 |
| 2019 | $876 | $27,689 | $3,053 | $24,636 |
| 2018 | $719 | $26,112 | $3,053 | $23,059 |
| 2017 | $703 | $25,152 | $3,053 | $22,099 |
| 2016 | $684 | $24,161 | $3,040 | $21,121 |
| 2015 | $672 | $24,161 | $3,040 | $21,121 |
| 2014 | $672 | $24,161 | $3,040 | $21,121 |
Source: Public Records
Map
Nearby Homes
- 104 Beech Creek Dr NW
- 102 Beech Creek Dr NW
- 8 Cameo Dr NW
- 124 Beech Creek Dr NW
- 16 Drexel Dr NW
- 2890 Alabama Hwy NW
- 7 Eden Dr NW
- 106 Eden Dr NW
- 3105 Barker Rd SW
- 224 Rolling Oaks Dr NW
- 125 Thornwood Dr SW
- 120 Thornwood Dr SW
- 203 Hycliff Rd SW
- 10 Bush Arbor Place SW
- 212 Rolling Oaks Dr NW
- 8 Bush Arbor Place SW
- 3605 Garden Lakes Pkwy
- 107 Beech Creek Dr NW
- 111 Beech Creek Dr NW
- 0 Beech Creek Dr NW Unit 7381700
- 0 Beech Creek Dr NW Unit 7341711
- 0 Beech Creek Dr NW Unit 7261185
- 0 Beech Creek Dr NW Unit 7097932
- 0 Beech Creek Dr NW Unit 7013206
- 0 Beech Creek Dr NW Unit 3204660
- 0 Beech Creek Dr NW Unit 3140350
- 0 Beech Creek Dr NW Unit 8763290
- 0 Beech Creek Dr NW Unit 8687911
- 0 Beech Creek Dr NW Unit 8526193
- 0 Beech Creek Dr NW Unit 8507550
- 0 Beech Creek Dr NW Unit 8475693
- 0 Beech Creek Dr NW Unit 8471695
- 0 Beech Creek Dr NW Unit 8274230
- 0 Beech Creek Dr NW Unit 8255316
- 0 Beech Creek Dr NW Unit 7193067
- 0 Beech Creek Dr NW Unit 7013142
- 0 Beech Creek Dr NW Unit 7326610