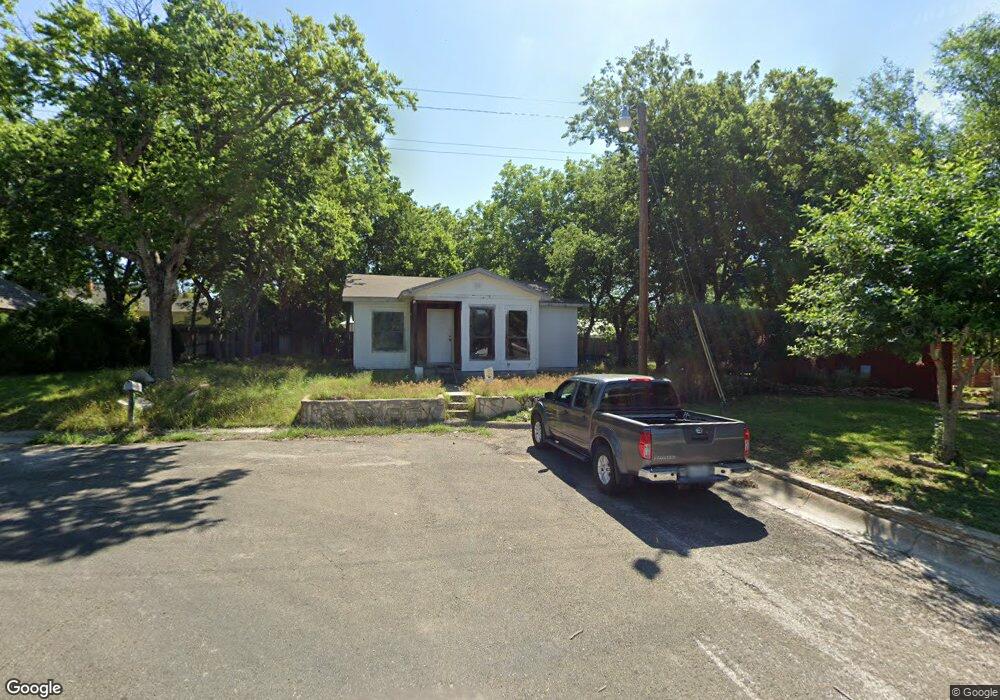
109 Bigham St Lampasas, TX 76550
Estimated Value: $80,937 - $209,000
--
Bed
--
Bath
1,182
Sq Ft
$129/Sq Ft
Est. Value
About This Home
This home is located at 109 Bigham St, Lampasas, TX 76550 and is currently estimated at $152,984, approximately $129 per square foot. 109 Bigham St is a home located in Lampasas County with nearby schools including Kline Whitis Elementary School, Lampasas Middle School, and Lampasas High School.
Ownership History
Date
Name
Owned For
Owner Type
Purchase Details
Closed on
Mar 29, 2021
Sold by
Rogers Jeri Michelle and Estate Of Dexter Duane Morris
Bought by
Rogers Ethan
Current Estimated Value
Purchase Details
Closed on
Sep 13, 2010
Sold by
Morris Gordon and Morris Teresa
Bought by
Morris Dexter Duane
Home Financials for this Owner
Home Financials are based on the most recent Mortgage that was taken out on this home.
Original Mortgage
$25,025
Outstanding Balance
$16,552
Interest Rate
4.55%
Estimated Equity
$136,432
Create a Home Valuation Report for This Property
The Home Valuation Report is an in-depth analysis detailing your home's value as well as a comparison with similar homes in the area
Home Values in the Area
Average Home Value in this Area
Purchase History
| Date | Buyer | Sale Price | Title Company |
|---|---|---|---|
| Rogers Ethan | -- | Lampasas County Abstract Co | |
| Morris Dexter Duane | $25,025 | -- |
Source: Public Records
Mortgage History
| Date | Status | Borrower | Loan Amount |
|---|---|---|---|
| Open | Morris Dexter Duane | $25,025 |
Source: Public Records
Tax History Compared to Growth
Tax History
| Year | Tax Paid | Tax Assessment Tax Assessment Total Assessment is a certain percentage of the fair market value that is determined by local assessors to be the total taxable value of land and additions on the property. | Land | Improvement |
|---|---|---|---|---|
| 2024 | $805 | $73,970 | $7,940 | $66,030 |
| 2023 | $499 | $27,100 | $6,800 | $20,300 |
| 2022 | $370 | $17,610 | $5,670 | $11,940 |
| 2021 | $470 | $19,380 | $6,240 | $13,140 |
| 2020 | $429 | $17,610 | $5,670 | $11,940 |
| 2019 | $445 | $17,620 | $5,670 | $11,950 |
| 2018 | $795 | $31,530 | $9,000 | $22,530 |
| 2017 | $1,259 | $50,470 | $9,000 | $41,470 |
| 2016 | $1,259 | $50,470 | $9,000 | $41,470 |
| 2015 | -- | $50,470 | $9,000 | $41,470 |
| 2014 | -- | $49,650 | $9,000 | $40,650 |
Source: Public Records
Map
Nearby Homes