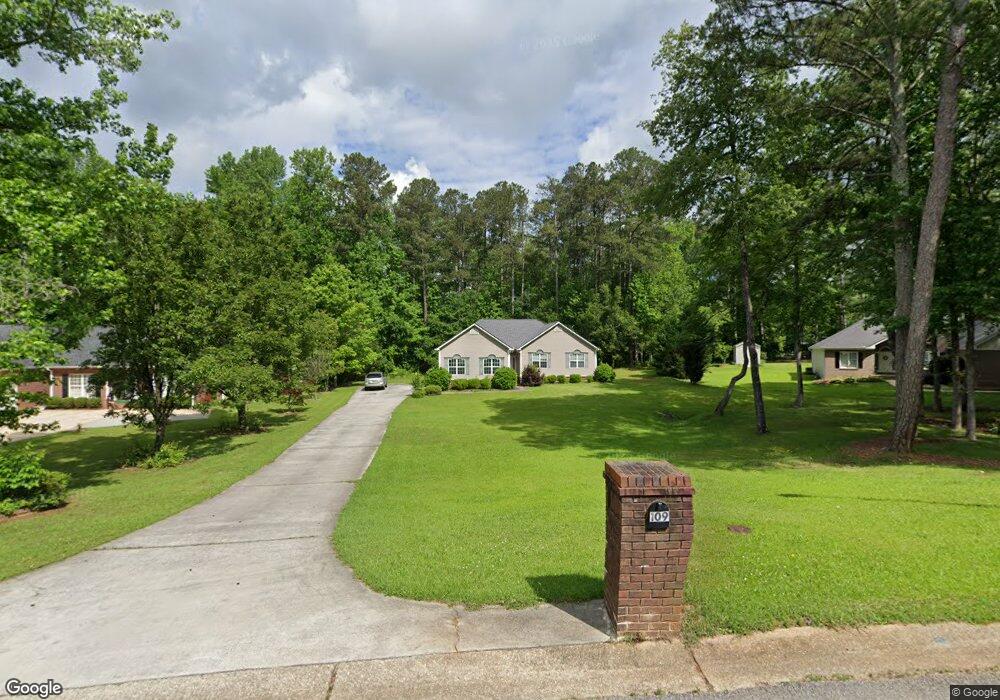
109 Brandy Chase Carrollton, GA 30117
Abilene NeighborhoodEstimated Value: $301,000 - $345,000
3
Beds
2
Baths
1,965
Sq Ft
$161/Sq Ft
Est. Value
About This Home
This home is located at 109 Brandy Chase, Carrollton, GA 30117 and is currently estimated at $316,523, approximately $161 per square foot. 109 Brandy Chase is a home located in Carroll County with nearby schools including Sharp Creek Elementary School, Central Middle School, and Central High School.
Ownership History
Date
Name
Owned For
Owner Type
Purchase Details
Closed on
Jul 30, 2008
Sold by
Harper Ricky J
Bought by
Harper Ricky J and Harper Valerie K
Current Estimated Value
Home Financials for this Owner
Home Financials are based on the most recent Mortgage that was taken out on this home.
Original Mortgage
$121,550
Outstanding Balance
$78,691
Interest Rate
6.31%
Mortgage Type
FHA
Estimated Equity
$237,832
Purchase Details
Closed on
Apr 1, 2008
Sold by
Not Provided
Bought by
Harper Ricky J and Harper Valerie K
Purchase Details
Closed on
Jan 27, 2006
Sold by
Not Provided
Bought by
Harper Ricky J and Harper Valerie K
Home Financials for this Owner
Home Financials are based on the most recent Mortgage that was taken out on this home.
Original Mortgage
$138,000
Interest Rate
6.14%
Mortgage Type
New Conventional
Purchase Details
Closed on
Aug 23, 2004
Sold by
Fulford James R
Bought by
Deerfield Homes Llc
Purchase Details
Closed on
Dec 23, 1996
Sold by
Buchanan
Bought by
Fulford James R
Purchase Details
Closed on
Aug 20, 1992
Bought by
Buchanan
Create a Home Valuation Report for This Property
The Home Valuation Report is an in-depth analysis detailing your home's value as well as a comparison with similar homes in the area
Home Values in the Area
Average Home Value in this Area
Purchase History
| Date | Buyer | Sale Price | Title Company |
|---|---|---|---|
| Harper Ricky J | -- | -- | |
| Harper Allison K | $123,500 | -- | |
| Harper Ricky J | $124,015 | -- | |
| Harper Ricky J | -- | -- | |
| Deerfield Homes Llc | $17,000 | -- | |
| Fulford James R | $107,200 | -- | |
| Buchanan | $7,000 | -- |
Source: Public Records
Mortgage History
| Date | Status | Borrower | Loan Amount |
|---|---|---|---|
| Open | Harper Allison K | $121,550 | |
| Previous Owner | Harper Ricky J | $138,000 |
Source: Public Records
Tax History
| Year | Tax Paid | Tax Assessment Tax Assessment Total Assessment is a certain percentage of the fair market value that is determined by local assessors to be the total taxable value of land and additions on the property. | Land | Improvement |
|---|---|---|---|---|
| 2025 | $2,113 | $116,629 | $12,000 | $104,629 |
| 2024 | $2,137 | $116,629 | $12,000 | $104,629 |
| 2023 | $2,137 | $107,168 | $12,000 | $95,168 |
| 2022 | $1,839 | $88,305 | $12,000 | $76,305 |
| 2021 | $1,688 | $77,415 | $12,000 | $65,415 |
| 2020 | $1,547 | $69,476 | $12,000 | $57,476 |
| 2019 | $1,458 | $63,986 | $12,000 | $51,986 |
| 2018 | $1,345 | $56,702 | $12,000 | $44,702 |
| 2017 | $1,415 | $60,348 | $12,000 | $48,348 |
| 2016 | $1,415 | $60,348 | $12,000 | $48,348 |
| 2015 | $1,343 | $52,011 | $8,000 | $44,011 |
| 2014 | $1,348 | $52,011 | $8,000 | $44,011 |
Source: Public Records
Map
Nearby Homes
- 338 Georgia 113
- 338 N Highway 113
- 85 Mary Ln
- 0 N Highway 113 Unit 151931
- 420 Henson Cir
- 405 W Barbara Ln
- 103 Kyle Way
- 133 Kyle Way
- 281 Northwinds Blvd Unit B3
- 281 Northwinds Blvd
- 20 Meadowcliff Trail
- 219 Candlewood Dr
- 524 Old Bremen Rd
- 145 S Meadowcliff Cir
- 2930 Highway 113
- 118 Zachary Dr
- 1015 Old Bremen Rd
- 133 Mote Rd
- 143 Springwood Dr
- 123 Sandalwood Dr
- 115 Brandy Chase
- 103 Brandy Chase
- 150 Linda Ln
- 180 Linda Ln
- 92 Brandy Chase
- 91 Brandy Chase
- 129 Brandy Chase
- 82 Brandy Chase
- 106 Brandy Chase
- 85 Brandy Chase
- 135 Brandy Chase
- 200 Linda Ln
- 72 Brandy Chase
- 120 Brandy Chase
- 120 Linda Ln
- 185 Linda Ln
- 25 Trey Ct
- 79 Brandy Chase
- 130 Brandy Chase
- 140 Brandy Chase
Your Personal Tour Guide
Ask me questions while you tour the home.