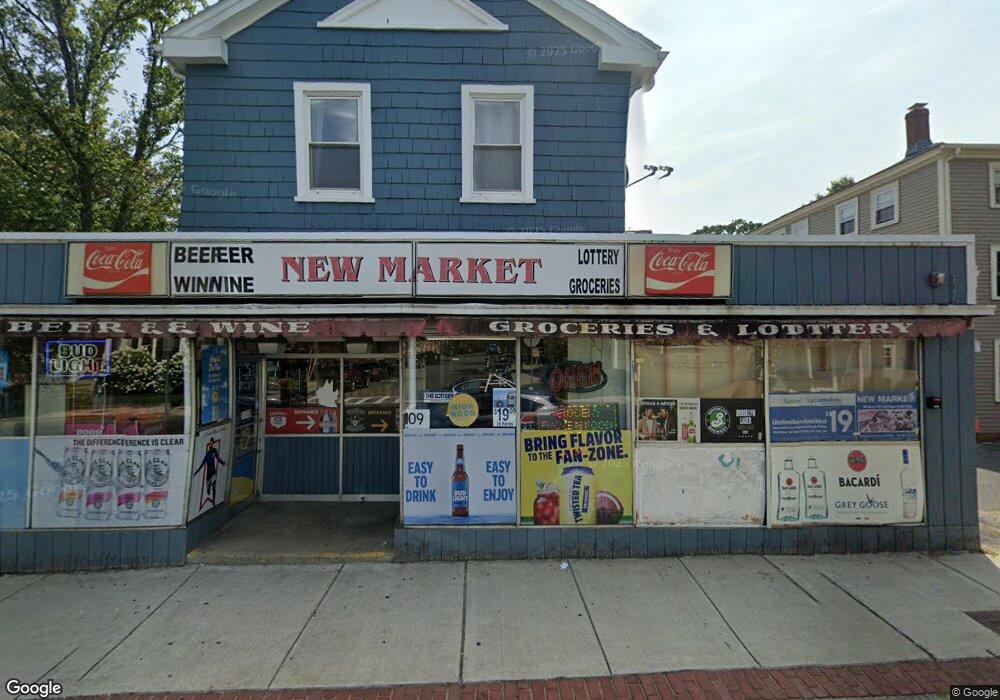
109 Bridge St Salem, MA 01970
Bridge Street NeighborhoodEstimated Value: $511,600
2
Beds
1
Bath
3,822
Sq Ft
$134/Sq Ft
Est. Value
About This Home
This home is located at 109 Bridge St, Salem, MA 01970 and is currently estimated at $511,600, approximately $133 per square foot. 109 Bridge St is a home located in Essex County with nearby schools including Carlton Elementary School, Saltonstall School, and Bates Elementary School.
Ownership History
Date
Name
Owned For
Owner Type
Purchase Details
Closed on
Dec 4, 2020
Sold by
New Market Rt
Bought by
Shiv Shakti Rt
Current Estimated Value
Purchase Details
Closed on
Mar 5, 2003
Sold by
Truong Lynda
Bought by
New Market Rt
Home Financials for this Owner
Home Financials are based on the most recent Mortgage that was taken out on this home.
Original Mortgage
$295,000
Interest Rate
5.95%
Mortgage Type
Commercial
Purchase Details
Closed on
Apr 19, 2000
Sold by
Kuszmar Theodore S
Bought by
Truong Lynda
Home Financials for this Owner
Home Financials are based on the most recent Mortgage that was taken out on this home.
Original Mortgage
$180,000
Interest Rate
8.21%
Mortgage Type
Commercial
Create a Home Valuation Report for This Property
The Home Valuation Report is an in-depth analysis detailing your home's value as well as a comparison with similar homes in the area
Home Values in the Area
Average Home Value in this Area
Purchase History
| Date | Buyer | Sale Price | Title Company |
|---|---|---|---|
| Shiv Shakti Rt | $375,000 | None Available | |
| New Market Rt | $375,000 | -- | |
| Truong Lynda | $220,000 | -- |
Source: Public Records
Mortgage History
| Date | Status | Borrower | Loan Amount |
|---|---|---|---|
| Previous Owner | Truong Lynda | $295,000 | |
| Previous Owner | Truong Lynda | $180,000 |
Source: Public Records
Tax History
| Year | Tax Paid | Tax Assessment Tax Assessment Total Assessment is a certain percentage of the fair market value that is determined by local assessors to be the total taxable value of land and additions on the property. | Land | Improvement |
|---|---|---|---|---|
| 2025 | -- | $667,200 | $287,700 | $379,500 |
| 2024 | -- | $591,800 | $260,800 | $331,000 |
| 2023 | $0 | $557,800 | $249,300 | $308,500 |
| 2022 | $0 | $501,000 | $201,500 | $299,500 |
| 2021 | $0 | $491,300 | $191,800 | $299,500 |
| 2020 | $0 | $466,200 | $182,000 | $284,200 |
| 2019 | $0 | $493,100 | $162,500 | $330,600 |
| 2018 | $0 | $424,900 | $143,000 | $281,900 |
| 2017 | $0 | $390,300 | $117,000 | $273,300 |
| 2016 | $8,971 | $390,300 | $117,000 | $273,300 |
| 2015 | $8,971 | $368,500 | $109,200 | $259,300 |
Source: Public Records
Map
Nearby Homes
- 16 Williams St
- 31 N Washington Square Unit 3
- 11 Williams St Unit 2
- 21 Emerton St Unit 2
- 7 Forrester St
- 40 Essex St Unit 2
- 16 Franklin St Unit 2403
- 16 Franklin St Unit 1303
- 16 Franklin St Unit 2202
- 17 Orchard St
- 17 Webb St Unit 1
- 69 Essex St Unit 2
- 41 Dearborn St
- 7 Curtis St Unit 1
- 8 Webb St
- 11 Church St Unit 203
- 11 Church St Unit 702
- 11 Church St Unit 703
- 65 Washington St Unit 512
- 10.5 Herbert St Unit 21
- 113 Bridge St Unit 3
- 113 Bridge St Unit 2R
- 113 Bridge St Unit 2L
- 113 Bridge St Unit 1
- 113-3 Bridge Unit 3
- 113-2L Bridge Unit 2L
- 8 Arbella St
- 113 1/2 Bridge St
- 107 Bridge St
- 107 Bridge St Unit 4
- 107 Bridge St Unit 3
- 107 Bridge St Unit 2
- 107 Bridge St Unit 1
- 113-2R Bridge Unit 2R
- 10 Arbella St
- 1 Arbella St
- 104 Bridge St Unit 1
- 104 Bridge St Unit 3
- 104 Bridge St Unit 2
- 104 Bridge St Unit 4
Your Personal Tour Guide
Ask me questions while you tour the home.