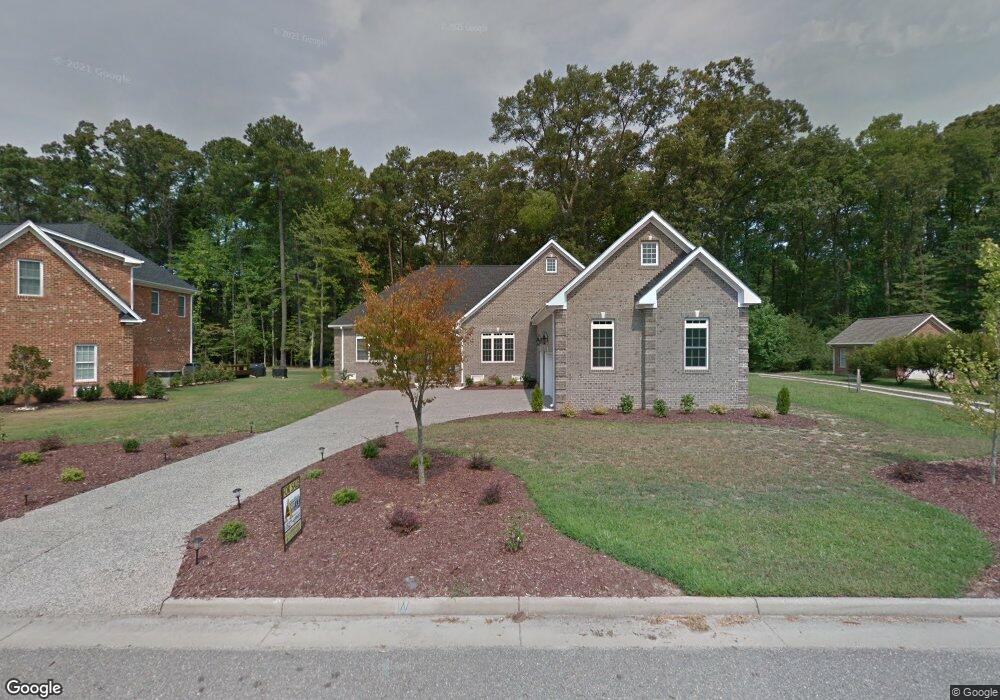
109 Bunting Point Rd Yorktown, VA 23693
Tabb NeighborhoodEstimated Value: $974,000 - $1,054,000
5
Beds
4
Baths
3,760
Sq Ft
$266/Sq Ft
Est. Value
About This Home
This home is located at 109 Bunting Point Rd, Yorktown, VA 23693 and is currently estimated at $1,001,391, approximately $266 per square foot. 109 Bunting Point Rd is a home located in York County with nearby schools including Mt. Vernon Elementary School, Tabb Middle School, and Tabb High School.
Ownership History
Date
Name
Owned For
Owner Type
Purchase Details
Closed on
Jul 20, 2023
Sold by
Coldsnow Matthew W and Coldsnow Jamie L
Bought by
Coldsnow Matthew W and Coldsnow Jamie L
Current Estimated Value
Purchase Details
Closed on
Apr 21, 2016
Sold by
Turner Andrew S and Turner Katie M
Bought by
Coldsnow Matthew W and Coldsnow Jamie L
Home Financials for this Owner
Home Financials are based on the most recent Mortgage that was taken out on this home.
Original Mortgage
$303,569
Interest Rate
3.68%
Mortgage Type
VA
Purchase Details
Closed on
Jun 24, 2013
Sold by
Mikes Homes Inc
Bought by
Turner Andrew S
Home Financials for this Owner
Home Financials are based on the most recent Mortgage that was taken out on this home.
Original Mortgage
$106,250
Interest Rate
3.59%
Mortgage Type
New Conventional
Create a Home Valuation Report for This Property
The Home Valuation Report is an in-depth analysis detailing your home's value as well as a comparison with similar homes in the area
Home Values in the Area
Average Home Value in this Area
Purchase History
| Date | Buyer | Sale Price | Title Company |
|---|---|---|---|
| Coldsnow Matthew W | -- | None Listed On Document | |
| Coldsnow Matthew W | $632,500 | None Available | |
| Turner Andrew S | $125,000 | -- |
Source: Public Records
Mortgage History
| Date | Status | Borrower | Loan Amount |
|---|---|---|---|
| Previous Owner | Coldsnow Matthew W | $303,569 | |
| Previous Owner | Turner Andrew S | $106,250 |
Source: Public Records
Tax History Compared to Growth
Tax History
| Year | Tax Paid | Tax Assessment Tax Assessment Total Assessment is a certain percentage of the fair market value that is determined by local assessors to be the total taxable value of land and additions on the property. | Land | Improvement |
|---|---|---|---|---|
| 2025 | $6,552 | $885,400 | $175,000 | $710,400 |
| 2024 | $6,552 | $885,400 | $175,000 | $710,400 |
| 2023 | $5,905 | $766,900 | $175,000 | $591,900 |
| 2022 | $5,982 | $766,900 | $175,000 | $591,900 |
| 2021 | $5,468 | $687,800 | $175,000 | $512,800 |
| 2020 | $5,468 | $687,800 | $175,000 | $512,800 |
| 2019 | $7,119 | $624,500 | $160,000 | $464,500 |
| 2018 | $7,119 | $624,500 | $160,000 | $464,500 |
| 2017 | $5,013 | $667,000 | $165,000 | $502,000 |
| 2016 | -- | $667,000 | $165,000 | $502,000 |
| 2015 | -- | $697,300 | $165,000 | $532,300 |
| 2014 | -- | $190,000 | $165,000 | $25,000 |
Source: Public Records
Map
Nearby Homes
- 814 Calthrop Neck Rd
- 112 Lambs Creek Dr
- 119 River Point Dr
- 106 Ocean Breeze Dr
- 105 Ocean Breeze Dr
- 15 Pickins Dr
- 9 Cherokee Dr
- 103 Darden Dr
- 15 Carriage Hill Dr
- 51 Carriage Hill Dr
- 639 Yorktown Rd
- 706 Yorktown Rd
- 11 Bull Run
- 40 Valmoore Dr
- 508 E Woodland Dr
- 103 Jonadab Rd
- 106 Running Man Trail
- 132 Breezy Point Dr
- 11 Dorothy Dr
- 410 Big Woods Dr Unit 2E
- 107 Bunting Point Rd
- 5 Bunting Point Rd
- 3 Bunting Point Rd
- 201 Bunting Point Rd
- 105 Bunting Point Rd
- 108 Bunting Point Rd
- 101 Pickett Place
- 103 Bunting Point Rd
- 101-Z Bunting Point Rd
- 103 Pickett Place
- 106 Bunting Point Rd
- 202 Bunting Point Rd
- 104 Pickett Place
- 117 Bunting Point Rd
- 104 Bunting Point Rd
- 1120 Calthrop Neck Rd
- 1116 Calthrop Neck Rd
- 1200 Calthrop Neck Rd
- 105 Pickett Place
- 1112 Calthrop Neck Rd