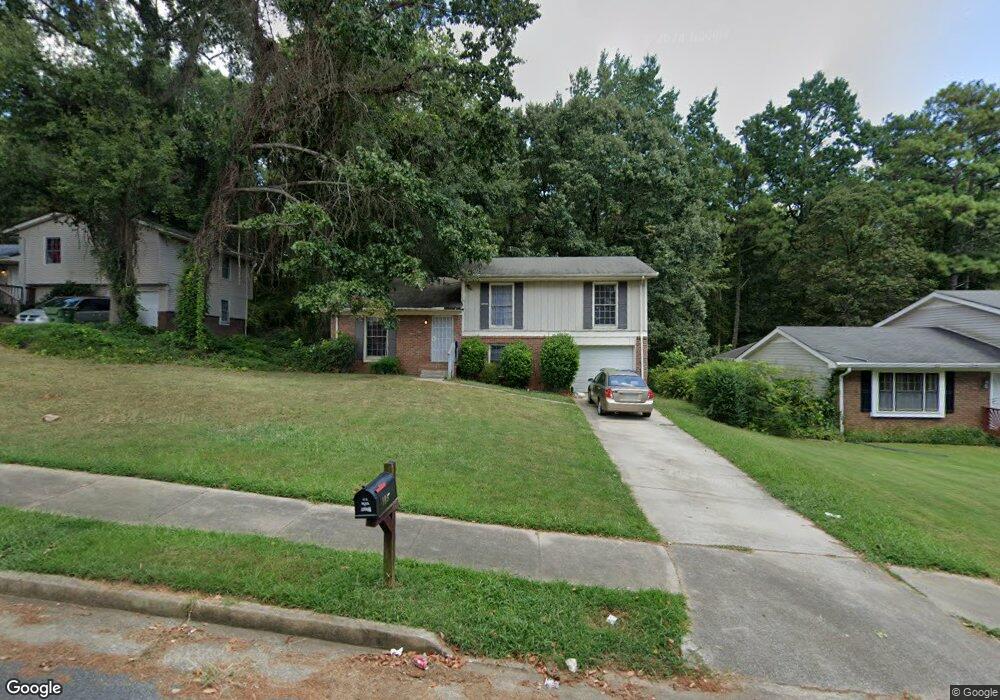
109 Burre Ln SW Atlanta, GA 30331
Baker Hills NeighborhoodEstimated Value: $192,000 - $221,000
3
Beds
2
Baths
1,242
Sq Ft
$168/Sq Ft
Est. Value
About This Home
This home is located at 109 Burre Ln SW, Atlanta, GA 30331 and is currently estimated at $208,453, approximately $167 per square foot. 109 Burre Ln SW is a home located in Fulton County with nearby schools including L.P. Miles Elementary School, Young Middle School, and Mays High School.
Ownership History
Date
Name
Owned For
Owner Type
Purchase Details
Closed on
May 5, 2017
Sold by
Hoff James P
Bought by
Twin Cribs Llc
Current Estimated Value
Purchase Details
Closed on
Aug 8, 2011
Sold by
Hoff James P
Bought by
Burre
Purchase Details
Closed on
Aug 31, 2009
Sold by
Burre Llc
Bought by
Hoff James
Purchase Details
Closed on
May 14, 2009
Sold by
Hoff James
Bought by
Burre Llc
Purchase Details
Closed on
Apr 3, 2009
Sold by
Atlanta R/E Insiders Llc
Bought by
Hoff James
Purchase Details
Closed on
Mar 31, 2009
Sold by
Morgan Stanle Trust 2007 & He1
Bought by
Atlanta R/E Insiders Llc
Purchase Details
Closed on
May 1, 2007
Sold by
Scott June Y
Bought by
Morgan Stanley Abs Trust 2007 &
Purchase Details
Closed on
Jan 10, 2000
Sold by
Sims Wardell
Bought by
Scott June Y
Home Financials for this Owner
Home Financials are based on the most recent Mortgage that was taken out on this home.
Original Mortgage
$85,317
Interest Rate
7.88%
Mortgage Type
FHA
Create a Home Valuation Report for This Property
The Home Valuation Report is an in-depth analysis detailing your home's value as well as a comparison with similar homes in the area
Home Values in the Area
Average Home Value in this Area
Purchase History
| Date | Buyer | Sale Price | Title Company |
|---|---|---|---|
| Twin Cribs Llc | $52,500 | -- | |
| Hoff James P | -- | -- | |
| Burre | -- | -- | |
| Hoff James | -- | -- | |
| Burre Llc | -- | -- | |
| Hoff James | $69,000 | -- | |
| Atlanta R/E Insiders Llc | $16,900 | -- | |
| Morgan Stanley Abs Trust 2007 & | $111,375 | -- | |
| Scott June Y | $86,000 | -- |
Source: Public Records
Mortgage History
| Date | Status | Borrower | Loan Amount |
|---|---|---|---|
| Previous Owner | Scott June Y | $85,317 |
Source: Public Records
Tax History Compared to Growth
Tax History
| Year | Tax Paid | Tax Assessment Tax Assessment Total Assessment is a certain percentage of the fair market value that is determined by local assessors to be the total taxable value of land and additions on the property. | Land | Improvement |
|---|---|---|---|---|
| 2025 | $2,095 | $73,400 | $21,800 | $51,600 |
| 2023 | $2,719 | $65,680 | $17,200 | $48,480 |
| 2022 | $2,658 | $65,680 | $17,200 | $48,480 |
| 2021 | $1,066 | $26,320 | $4,840 | $21,480 |
| 2020 | $916 | $26,320 | $4,840 | $21,480 |
| 2019 | $492 | $30,160 | $4,840 | $25,320 |
| 2018 | $864 | $20,880 | $2,760 | $18,120 |
| 2017 | $731 | $16,920 | $5,000 | $11,920 |
| 2016 | $733 | $16,920 | $5,000 | $11,920 |
| 2015 | $1,230 | $16,920 | $5,000 | $11,920 |
| 2014 | $767 | $16,920 | $5,000 | $11,920 |
Source: Public Records
Map
Nearby Homes
- 3877 Bakers Ferry
- 7098 Chara Ln SW
- 3961 Cornell Blvd SW
- 273 Fennel Way SW
- 3911 Cornell Blvd SW
- 4015 Bakers Ferry Rd SW
- 259 Tarragon Way SW
- 4063 Cornell Blvd SW
- 3798 Bakers Ferry Rd SW
- 3981 Rutgers Dr SW
- 4020 Ester Dr SW
- 3991 Adamsville Dr SW
- 4039 Codel St SW
- 294 Leland Place SW
- 4142 Woodland Park Dr SW
- 446 Tarragon Way SW
- 482 Tarragon Way SW
- 3857 Kenner Dr SW
- 3763 Boulder Park Dr SW
- 115 Burre Ln SW
- 101 Burre Ln SW
- 93 Burre Ln SW
- 123 Burre Ln SW
- 3976 Ferry Ln SW
- 3977 Ferry Ln SW
- 0 Ferry Ln SW Unit 7156624
- 0 Ferry Ln SW Unit 7162872
- 0 Ferry Ln SW Unit 7068997
- 0 Ferry Ln SW Unit 3152496
- 0 Ferry Ln SW Unit 3119092
- 3977 Ferry Heights Dr SW
- 133 Burre Ln SW
- 85 Burre Ln SW
- 3984 Ferry Ln SW
- 3985 Ferry Ln SW
- 3900 Majestic Dr SW
- 3900 Majestic Dr SW Unit 14F-0024- LL-111-3
- 0 Bakers Ferry Majestic SW Unit 3259521
- 130 Burre Ln SW