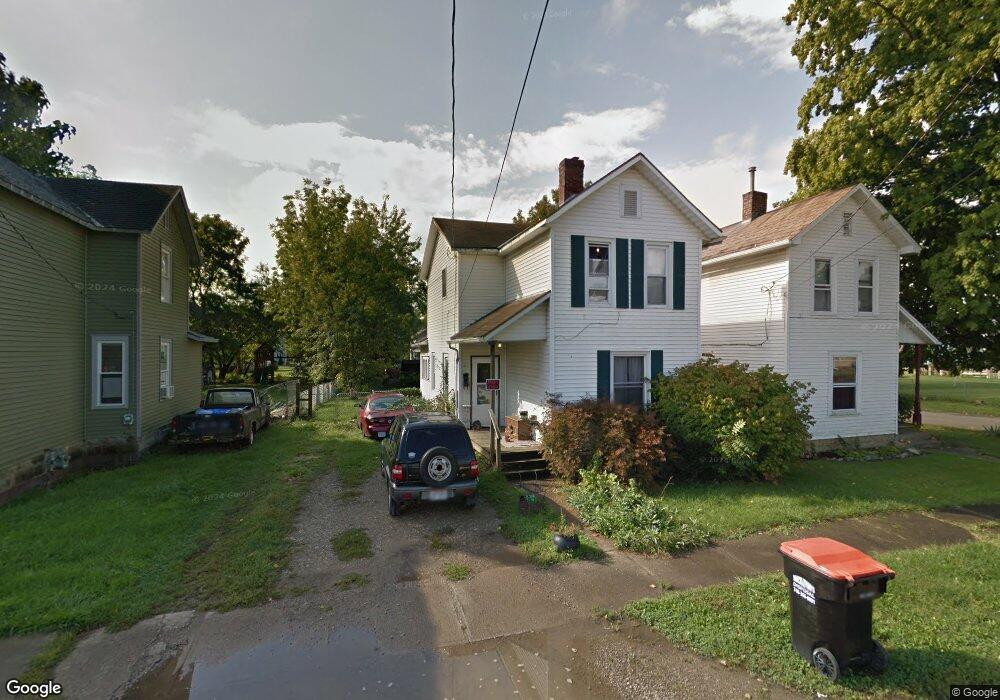
109 Burt Ave Newark, OH 43055
Estimated Value: $149,824 - $171,000
2
Beds
2
Baths
1,109
Sq Ft
$144/Sq Ft
Est. Value
About This Home
This home is located at 109 Burt Ave, Newark, OH 43055 and is currently estimated at $160,206, approximately $144 per square foot. 109 Burt Ave is a home located in Licking County with nearby schools including Mcguffey Elementary School, Wilson Middle School, and Newark High School.
Ownership History
Date
Name
Owned For
Owner Type
Purchase Details
Closed on
Jun 12, 2023
Sold by
Plunkett Joseph M
Bought by
Angus Brandy A
Current Estimated Value
Home Financials for this Owner
Home Financials are based on the most recent Mortgage that was taken out on this home.
Original Mortgage
$68,800
Outstanding Balance
$67,020
Interest Rate
6.57%
Mortgage Type
New Conventional
Estimated Equity
$93,186
Purchase Details
Closed on
Apr 16, 2004
Sold by
Johnson Michael E and Johnson Christine R
Bought by
Angus Brandy A and Plunkett Joseph M
Purchase Details
Closed on
Apr 8, 2004
Sold by
Estate Of Vicky L Johnson
Bought by
Johnson Michael E
Purchase Details
Closed on
Mar 3, 2003
Sold by
Johnson Michael
Bought by
Angus Brandy A and Plunkett Joseph M
Home Financials for this Owner
Home Financials are based on the most recent Mortgage that was taken out on this home.
Original Mortgage
$77,779
Interest Rate
6.07%
Mortgage Type
FHA
Create a Home Valuation Report for This Property
The Home Valuation Report is an in-depth analysis detailing your home's value as well as a comparison with similar homes in the area
Home Values in the Area
Average Home Value in this Area
Purchase History
| Date | Buyer | Sale Price | Title Company |
|---|---|---|---|
| Angus Brandy A | -- | None Listed On Document | |
| Angus Brandy A | -- | -- | |
| Johnson Michael E | -- | -- | |
| Angus Brandy A | $79,000 | -- |
Source: Public Records
Mortgage History
| Date | Status | Borrower | Loan Amount |
|---|---|---|---|
| Open | Angus Brandy A | $68,800 | |
| Previous Owner | Angus Brandy A | $77,779 |
Source: Public Records
Tax History Compared to Growth
Tax History
| Year | Tax Paid | Tax Assessment Tax Assessment Total Assessment is a certain percentage of the fair market value that is determined by local assessors to be the total taxable value of land and additions on the property. | Land | Improvement |
|---|---|---|---|---|
| 2024 | $1,321 | $36,930 | $7,600 | $29,330 |
| 2023 | $1,319 | $36,930 | $7,600 | $29,330 |
| 2022 | $1,049 | $26,080 | $4,550 | $21,530 |
| 2021 | $1,100 | $26,080 | $4,550 | $21,530 |
| 2020 | $1,125 | $26,080 | $4,550 | $21,530 |
| 2019 | $912 | $20,340 | $3,780 | $16,560 |
| 2018 | $912 | $0 | $0 | $0 |
| 2017 | $953 | $0 | $0 | $0 |
| 2016 | $1,010 | $0 | $0 | $0 |
| 2015 | $1,032 | $0 | $0 | $0 |
| 2014 | $1,321 | $0 | $0 | $0 |
| 2013 | $1,009 | $0 | $0 | $0 |
Source: Public Records
Map
Nearby Homes