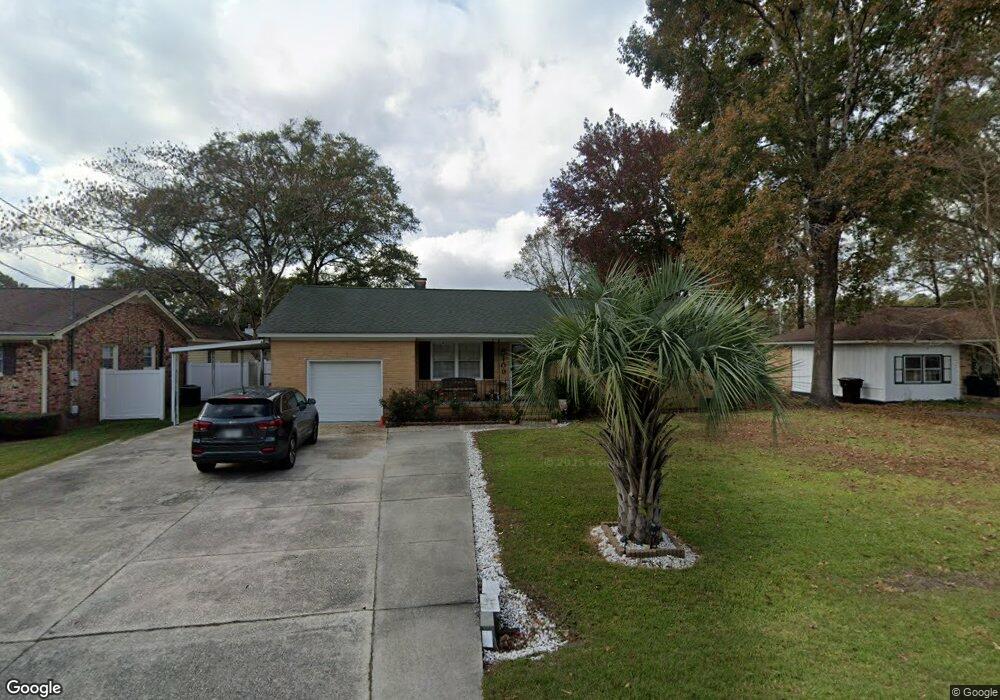
109 Camelot Dr Goose Creek, SC 29445
Estimated Value: $303,000 - $323,000
--
Bed
--
Bath
1,526
Sq Ft
$206/Sq Ft
Est. Value
About This Home
This home is located at 109 Camelot Dr, Goose Creek, SC 29445 and is currently estimated at $314,490, approximately $206 per square foot. 109 Camelot Dr is a home located in Berkeley County with nearby schools including Westview Primary School, Westview Elementary School, and Westview Middle School.
Ownership History
Date
Name
Owned For
Owner Type
Purchase Details
Closed on
Aug 5, 2019
Sold by
Barcelata Jose Rodriguez and Redriguez Tosha
Bought by
Levine Krystal and Andre Levine D
Current Estimated Value
Home Financials for this Owner
Home Financials are based on the most recent Mortgage that was taken out on this home.
Original Mortgage
$165,000
Outstanding Balance
$144,510
Interest Rate
3.7%
Mortgage Type
New Conventional
Estimated Equity
$169,980
Purchase Details
Closed on
Apr 25, 2008
Sold by
Peagler Douglas W
Bought by
Barcelata Jose Rodriguez and Rodriguez Tosha
Home Financials for this Owner
Home Financials are based on the most recent Mortgage that was taken out on this home.
Original Mortgage
$140,215
Interest Rate
8.25%
Mortgage Type
Purchase Money Mortgage
Purchase Details
Closed on
Mar 31, 2000
Sold by
Dill Mark A
Bought by
Peagler Douglas W
Create a Home Valuation Report for This Property
The Home Valuation Report is an in-depth analysis detailing your home's value as well as a comparison with similar homes in the area
Home Values in the Area
Average Home Value in this Area
Purchase History
| Date | Buyer | Sale Price | Title Company |
|---|---|---|---|
| Levine Krystal | $185,000 | None Available | |
| Barcelata Jose Rodriguez | $140,215 | -- | |
| Peagler Douglas W | $91,000 | -- |
Source: Public Records
Mortgage History
| Date | Status | Borrower | Loan Amount |
|---|---|---|---|
| Open | Levine Krystal | $165,000 | |
| Previous Owner | Barcelata Jose Rodriguez | $140,215 |
Source: Public Records
Tax History Compared to Growth
Tax History
| Year | Tax Paid | Tax Assessment Tax Assessment Total Assessment is a certain percentage of the fair market value that is determined by local assessors to be the total taxable value of land and additions on the property. | Land | Improvement |
|---|---|---|---|---|
| 2025 | $1,138 | $202,975 | $39,435 | $163,540 |
| 2024 | $1,138 | $8,119 | $1,577 | $6,542 |
| 2023 | $1,138 | $8,119 | $1,577 | $6,542 |
| 2022 | $1,117 | $7,060 | $1,400 | $5,660 |
| 2021 | $1,203 | $7,060 | $1,400 | $5,660 |
| 2020 | $1,150 | $7,060 | $1,400 | $5,660 |
| 2019 | $1,002 | $7,060 | $1,400 | $5,660 |
| 2018 | $915 | $5,432 | $1,400 | $4,032 |
| 2017 | $909 | $5,432 | $1,400 | $4,032 |
| 2016 | $915 | $5,430 | $1,400 | $4,030 |
| 2015 | $864 | $5,430 | $1,400 | $4,030 |
| 2014 | $811 | $5,430 | $1,400 | $4,030 |
| 2013 | -- | $5,430 | $1,400 | $4,030 |
Source: Public Records
Map
Nearby Homes
- 121 Camelot Dr
- 0 Carolina Ave Unit 24013885
- 109 Lyle Rd
- 208 Janice St
- 112 Elaine St
- 100 Camellia Rd
- 222 Jennie St
- 1001 Middleton Dr
- 2000 Middleton Dr
- 5000 Middleton Dr
- 4000 Middleton Dr
- 105 Magnolia Dr
- 301 Farm Rd
- Aspen Plan at The Oaks
- Sago Plan at The Oaks
- Juniper II Plan at The Oaks
- Ivy Plan at The Oaks
- 111 Laurel Ave
- 301 Morrison Dr
- 118 Englewood Rd