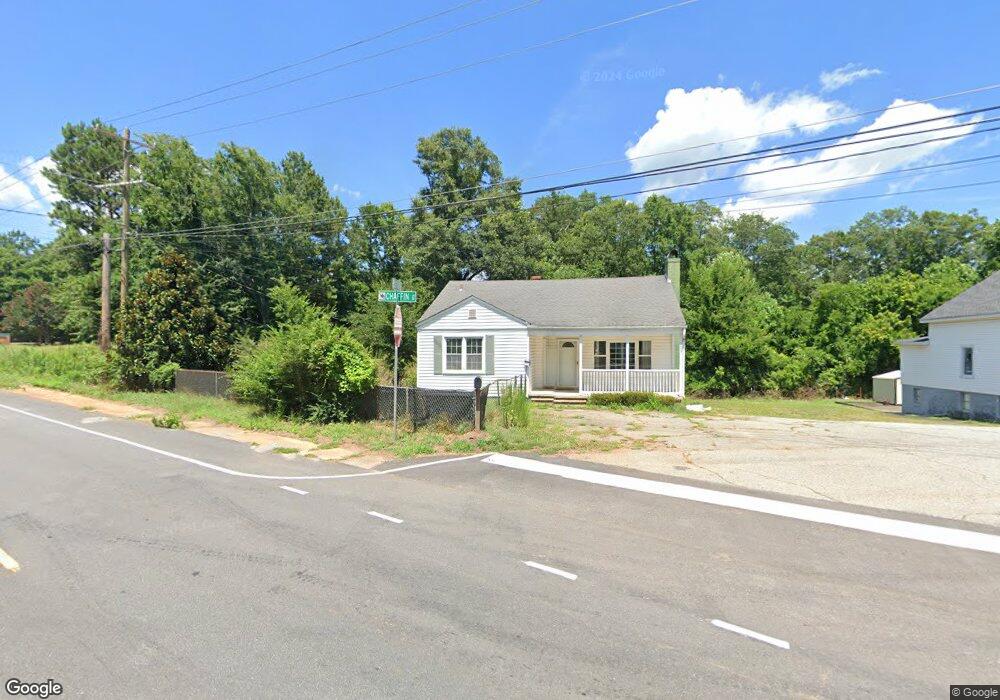
109 Chaffin St Glendale, SC 29346
Estimated Value: $64,000 - $149,000
2
Beds
1
Bath
905
Sq Ft
$129/Sq Ft
Est. Value
About This Home
This home is located at 109 Chaffin St, Glendale, SC 29346 and is currently estimated at $116,645, approximately $128 per square foot. 109 Chaffin St is a home located in Spartanburg County with nearby schools including Broome High School.
Ownership History
Date
Name
Owned For
Owner Type
Purchase Details
Closed on
Aug 5, 2016
Sold by
Jpmorgan Chase Bank National Association
Bought by
Bridges Jerry
Current Estimated Value
Purchase Details
Closed on
Dec 18, 2015
Sold by
Jpmorgan Chase Bank National Association
Bought by
Jpmorgan Chase Bank National Association
Purchase Details
Closed on
Mar 12, 2010
Sold by
Manna Baptist Church
Bought by
Gore Ricky D
Home Financials for this Owner
Home Financials are based on the most recent Mortgage that was taken out on this home.
Original Mortgage
$60,714
Interest Rate
4.93%
Mortgage Type
New Conventional
Purchase Details
Closed on
Aug 14, 2009
Sold by
Manna Baptist Church
Bought by
Living Waters Deliverance Center Evangel
Home Financials for this Owner
Home Financials are based on the most recent Mortgage that was taken out on this home.
Original Mortgage
$89,900
Interest Rate
5.26%
Mortgage Type
Seller Take Back
Create a Home Valuation Report for This Property
The Home Valuation Report is an in-depth analysis detailing your home's value as well as a comparison with similar homes in the area
Home Values in the Area
Average Home Value in this Area
Purchase History
| Date | Buyer | Sale Price | Title Company |
|---|---|---|---|
| Bridges Jerry | $21,000 | None Available | |
| Jpmorgan Chase Bank National Association | $30,600 | None Available | |
| Gore Ricky D | $59,500 | -- | |
| Living Waters Deliverance Center Evangel | $99,900 | -- |
Source: Public Records
Mortgage History
| Date | Status | Borrower | Loan Amount |
|---|---|---|---|
| Previous Owner | Gore Ricky D | $60,714 | |
| Previous Owner | Living Waters Deliverance Center Evangel | $89,900 |
Source: Public Records
Tax History Compared to Growth
Tax History
| Year | Tax Paid | Tax Assessment Tax Assessment Total Assessment is a certain percentage of the fair market value that is determined by local assessors to be the total taxable value of land and additions on the property. | Land | Improvement |
|---|---|---|---|---|
| 2025 | $2,134 | $4,947 | $896 | $4,051 |
| 2024 | $2,134 | $4,947 | $896 | $4,051 |
| 2023 | $2,134 | $4,947 | $896 | $4,051 |
| 2022 | $1,927 | $4,302 | $720 | $3,582 |
| 2021 | $1,916 | $4,302 | $720 | $3,582 |
| 2020 | $1,900 | $4,302 | $720 | $3,582 |
| 2019 | $2,020 | $4,302 | $720 | $3,582 |
| 2018 | $1,823 | $4,302 | $720 | $3,582 |
| 2017 | $1,608 | $3,744 | $720 | $3,024 |
| 2016 | $1,865 | $4,362 | $720 | $3,642 |
| 2015 | $466 | $2,908 | $480 | $2,428 |
| 2014 | $461 | $2,908 | $480 | $2,428 |
Source: Public Records
Map
Nearby Homes
- 175 Chaffin St
- 3291 Clifton Glendale Rd
- 0 Cedar Canyon Dr
- 150 Emma Cudd Rd
- 170 Sutton Rd
- 451 Emma Cudd Rd
- 0 Lewis Chapel Rd
- 161 Townsend Ct
- 141 Townsend Ct
- 115 Edgecombe Rd
- 320 Fairlane Dr
- 3013 Country Club Rd
- 110 Edgecombe Rd
- 6010 Ives Ave
- 5095 Ives Ave
- 6059 Ives Ave
- 380 Indian Creek Rd
- 125 Thunderbird Place
- 432 Savanna Plains Dr
- 306 Savanna Plains Dr
- 121 Chaffin St
- 2370 Pecan Dr
- 130 Chaffin St
- 3530 Clifton Glendale Rd
- 121 Hottel Cir
- 3530 Pecan Dr
- 140 Chaffin St
- 111 Hottel Cir
- 2360 Pecan Dr
- 3540 Clifton Glendale Rd
- 3390 Clifton Glendale Rd
- 2351 Pecan Dr
- 160 Chaffin St
- 3544 Clifton Glendale Rd
- 165 Chaffin St
- 170 Chaffin St
- 3311 Clifton Glendale Rd
- 180 Chaffin St
- 2345 Pecan Dr
- 140 Church St