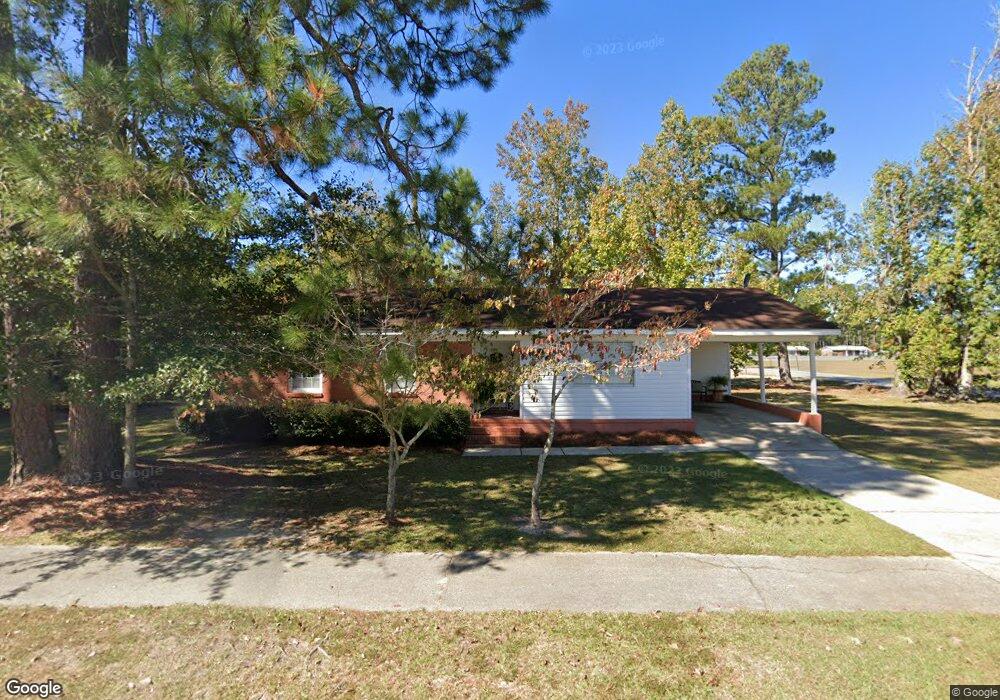
109 Charles Rogers Blvd Hazlehurst, GA 31539
Estimated Value: $115,000 - $134,000
3
Beds
1
Bath
1,256
Sq Ft
$102/Sq Ft
Est. Value
About This Home
This home is located at 109 Charles Rogers Blvd, Hazlehurst, GA 31539 and is currently estimated at $127,516, approximately $101 per square foot. 109 Charles Rogers Blvd is a home located in Jeff Davis County with nearby schools including Jeff Davis Primary School, Jeff Davis Elementary School, and Jeff Davis Middle School.
Ownership History
Date
Name
Owned For
Owner Type
Purchase Details
Closed on
Mar 23, 2006
Sold by
Carter Becky R
Bought by
Whitfield Harold
Current Estimated Value
Home Financials for this Owner
Home Financials are based on the most recent Mortgage that was taken out on this home.
Original Mortgage
$50,197
Outstanding Balance
$28,470
Interest Rate
6.23%
Mortgage Type
New Conventional
Estimated Equity
$99,046
Purchase Details
Closed on
Jan 24, 2006
Sold by
Carter Becky R
Bought by
Whitfield Harold
Home Financials for this Owner
Home Financials are based on the most recent Mortgage that was taken out on this home.
Original Mortgage
$50,197
Outstanding Balance
$28,470
Interest Rate
6.23%
Mortgage Type
New Conventional
Estimated Equity
$99,046
Purchase Details
Closed on
Jun 20, 2005
Sold by
Murray Lois Marie
Bought by
Carter Becky R
Purchase Details
Closed on
Jan 1, 1984
Bought by
Murray Marie
Create a Home Valuation Report for This Property
The Home Valuation Report is an in-depth analysis detailing your home's value as well as a comparison with similar homes in the area
Home Values in the Area
Average Home Value in this Area
Purchase History
| Date | Buyer | Sale Price | Title Company |
|---|---|---|---|
| Whitfield Harold | $8,000 | -- | |
| Whitfield Harold | $8,000 | -- | |
| Carter Becky R | -- | -- | |
| Murray Marie | $27,000 | -- |
Source: Public Records
Mortgage History
| Date | Status | Borrower | Loan Amount |
|---|---|---|---|
| Open | Whitfield Harold | $50,197 |
Source: Public Records
Tax History Compared to Growth
Tax History
| Year | Tax Paid | Tax Assessment Tax Assessment Total Assessment is a certain percentage of the fair market value that is determined by local assessors to be the total taxable value of land and additions on the property. | Land | Improvement |
|---|---|---|---|---|
| 2024 | $1,678 | $44,880 | $2,000 | $42,880 |
| 2023 | $952 | $25,462 | $2,000 | $23,462 |
| 2022 | $952 | $25,462 | $2,000 | $23,462 |
| 2021 | $952 | $25,462 | $2,000 | $23,462 |
| 2020 | $952 | $25,462 | $2,000 | $23,462 |
| 2019 | $952 | $25,462 | $2,000 | $23,462 |
| 2018 | $952 | $25,462 | $2,000 | $23,462 |
| 2017 | $684 | $23,676 | $2,000 | $21,676 |
| 2016 | $642 | $22,635 | $2,000 | $20,635 |
| 2015 | -- | $22,635 | $2,000 | $20,635 |
| 2014 | -- | $22,635 | $2,000 | $20,635 |
Source: Public Records
Map
Nearby Homes
- 0 Charles Rogers Blvd
- 54 Walton Way
- 44 Kersey St
- 45 Elton St
- 116 Walton Way
- 00 Pat Dixon St & Charles Rogers Blvd
- 9 Kersey St
- 73 Latimer St
- 4 Lakeside Dr
- 20 W Sycamore St
- 6 Lynnwood Dr
- 19 Martin Luther King jr Blvd
- 17 Young St
- 39 N Tallahassee St
- 00 N Tallahassee St
- 21 Pine St
- 104 N Tallahassee St
- 0 Collins St
- 95 E Plum St
- 74 Leslie Rd
- 91 Kersey St Unit 1
- 91 Kersey St
- 106 Charles Rogers Blvd
- 95 Kersey St
- 00 Charles Roger Blvd & Pine Forest Ave
- 80 Kersey St
- 77 Kersey St
- 102 Charles Rogers Blvd
- 0 Kersey St
- N/A Kersey St
- N/A Weatherly St
- N/A Charles Rogers Blvd
- 73 Kersey St Unit 1
- 73 Kersey St
- 7 Becky Ln
- 103 Kersey St
- 17 Weatherly St
- 69 Kersey St
- 107 Kersey St
- 67 Kersey St