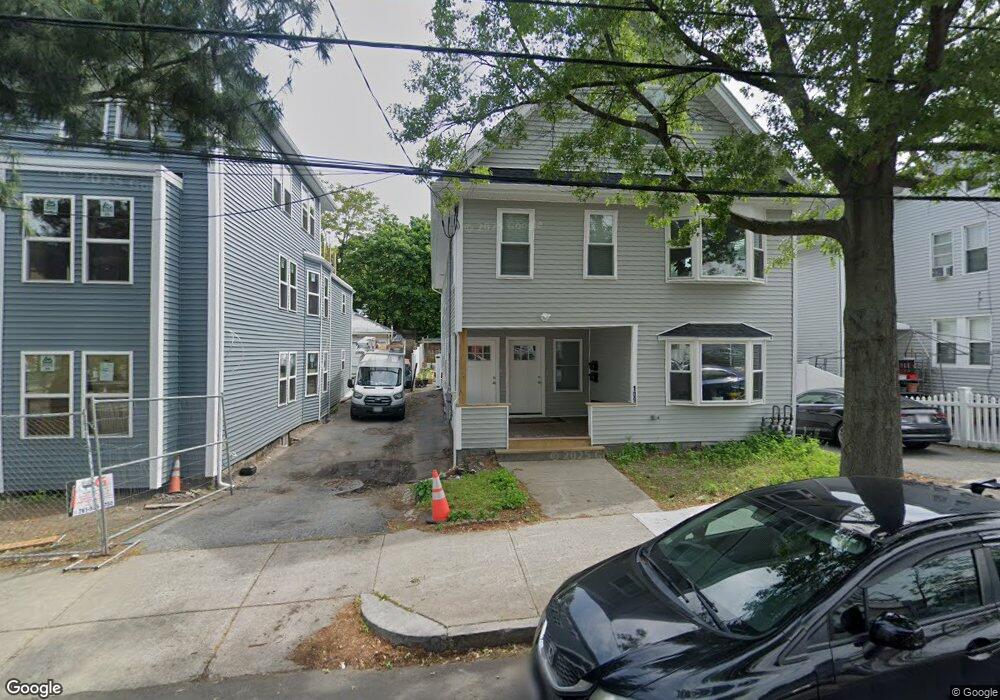
109 Chestnut St Lynn, MA 01902
Fayette Street NeighborhoodEstimated Value: $536,000 - $776,000
5
Beds
2
Baths
2,528
Sq Ft
$254/Sq Ft
Est. Value
About This Home
This home is located at 109 Chestnut St, Lynn, MA 01902 and is currently estimated at $642,573, approximately $254 per square foot. 109 Chestnut St is a home located in Essex County with nearby schools including Ingalls Elementary School, William R. Fallon School, and Marshall Middle School.
Ownership History
Date
Name
Owned For
Owner Type
Purchase Details
Closed on
Aug 3, 2012
Sold by
Son Eap and Son Sarim
Bought by
Son Eap
Current Estimated Value
Purchase Details
Closed on
Sep 20, 2004
Sold by
Yim Chhut
Bought by
Son Eap
Purchase Details
Closed on
Oct 12, 2000
Sold by
Sanghikaram Khmer T and Mom Ven K
Bought by
Yim Chhut
Home Financials for this Owner
Home Financials are based on the most recent Mortgage that was taken out on this home.
Original Mortgage
$149,900
Interest Rate
7.89%
Mortgage Type
Purchase Money Mortgage
Purchase Details
Closed on
Nov 25, 1987
Sold by
Baldwin Albert E
Bought by
Cambodian Buddhist Ctr
Home Financials for this Owner
Home Financials are based on the most recent Mortgage that was taken out on this home.
Original Mortgage
$135,150
Interest Rate
11.59%
Mortgage Type
Purchase Money Mortgage
Create a Home Valuation Report for This Property
The Home Valuation Report is an in-depth analysis detailing your home's value as well as a comparison with similar homes in the area
Home Values in the Area
Average Home Value in this Area
Purchase History
| Date | Buyer | Sale Price | Title Company |
|---|---|---|---|
| Son Eap | -- | -- | |
| Son Eap | -- | -- | |
| Son Eap | -- | -- | |
| Son Eap | -- | -- | |
| Yim Chhut | $150,000 | -- | |
| Yim Chhut | $150,000 | -- | |
| Cambodian Buddhist Ctr | $159,000 | -- |
Source: Public Records
Mortgage History
| Date | Status | Borrower | Loan Amount |
|---|---|---|---|
| Previous Owner | Cambodian Buddhist Ctr | $149,900 | |
| Previous Owner | Cambodian Buddhist Ctr | $135,150 |
Source: Public Records
Tax History Compared to Growth
Tax History
| Year | Tax Paid | Tax Assessment Tax Assessment Total Assessment is a certain percentage of the fair market value that is determined by local assessors to be the total taxable value of land and additions on the property. | Land | Improvement |
|---|---|---|---|---|
| 2025 | $3,483 | $336,185 | $183,300 | $152,885 |
| 2024 | $3,331 | $316,300 | $174,200 | $142,100 |
| 2023 | $7,384 | $662,200 | $158,600 | $503,600 |
| 2022 | $7,494 | $602,900 | $135,700 | $467,200 |
| 2021 | $7,104 | $545,200 | $128,400 | $416,800 |
| 2020 | $6,575 | $490,700 | $119,300 | $371,400 |
| 2019 | $6,246 | $436,800 | $102,900 | $333,900 |
| 2018 | $5,719 | $377,500 | $95,100 | $282,400 |
| 2017 | $5,558 | $356,300 | $89,000 | $267,300 |
| 2016 | $5,064 | $313,000 | $76,500 | $236,500 |
| 2015 | $4,737 | $282,800 | $72,600 | $210,200 |
Source: Public Records
Map
Nearby Homes
- 24 Parrott St
- 38 Chestnut St
- 248 Essex St
- 7 Sidney Ave
- 14-16 Dexter St
- 344 Essex St
- 129 Williams Ave
- 42 Joyce St Unit H
- 13 Portland St Unit 4
- 380 Essex St
- 12 Chestnut Ave
- 14 Mount Pleasant Place
- 175 Essex St
- 26 Groveland St
- 2 Mount Vernon St
- 13 Nahant St Unit 2D
- 13 Nahant St Unit 4A
- 13 Nahant St Unit 3A
- 13 Nahant St Unit 4C
- 13 Nahant St Unit 3B
- 111 Chestnut St
- 103 Chestnut St
- 99 Chestnut St
- 113 Chestnut St
- 99 1/2 Chestnut St
- 99-1/2 Chestnut St
- 117 Chestnut St
- 121 Chestnut St
- 22 Olive St
- 18 Fayette St
- 93 Chestnut St
- 118 Chestnut St
- 91 Chestnut St
- 91 Chestnut St Unit 2
- 91 Chestnut St Unit 1
- 123 Chestnut St Unit 125
- 28 Olive St
- 126 Chestnut St Unit 2B
- 126 Chestnut St Unit 1B
- 89 Chestnut St