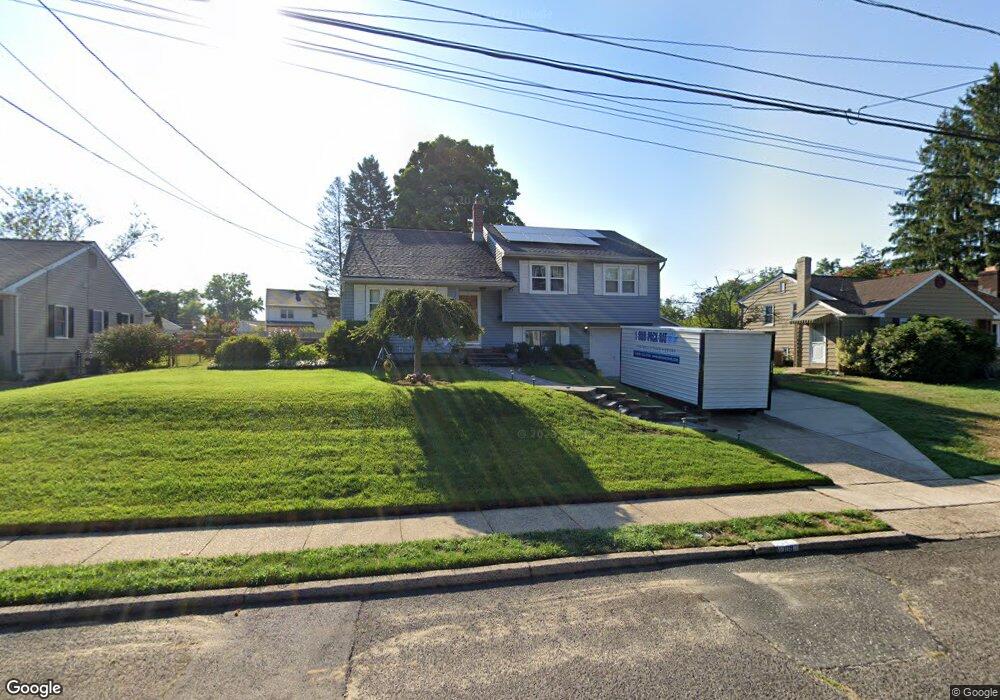
109 Dawn Dr Mount Holly, NJ 08060
Estimated Value: $359,789 - $424,000
--
Bed
--
Bath
1,848
Sq Ft
$213/Sq Ft
Est. Value
About This Home
This home is located at 109 Dawn Dr, Mount Holly, NJ 08060 and is currently estimated at $394,447, approximately $213 per square foot. 109 Dawn Dr is a home located in Burlington County with nearby schools including John Brainerd Elementary School, Folwell Elementary School, and F.W. Holbein School.
Ownership History
Date
Name
Owned For
Owner Type
Purchase Details
Closed on
May 30, 1997
Sold by
Zingaro Robert E and Zingaro Roseann M
Bought by
Baldwin Cynthia A and Baldwin Troy A
Current Estimated Value
Home Financials for this Owner
Home Financials are based on the most recent Mortgage that was taken out on this home.
Original Mortgage
$116,000
Outstanding Balance
$16,585
Interest Rate
7.97%
Mortgage Type
VA
Estimated Equity
$377,862
Create a Home Valuation Report for This Property
The Home Valuation Report is an in-depth analysis detailing your home's value as well as a comparison with similar homes in the area
Home Values in the Area
Average Home Value in this Area
Purchase History
| Date | Buyer | Sale Price | Title Company |
|---|---|---|---|
| Baldwin Cynthia A | $126,000 | Surety Title Corporation |
Source: Public Records
Mortgage History
| Date | Status | Borrower | Loan Amount |
|---|---|---|---|
| Open | Baldwin Cynthia A | $116,000 |
Source: Public Records
Tax History Compared to Growth
Tax History
| Year | Tax Paid | Tax Assessment Tax Assessment Total Assessment is a certain percentage of the fair market value that is determined by local assessors to be the total taxable value of land and additions on the property. | Land | Improvement |
|---|---|---|---|---|
| 2025 | $7,970 | $227,000 | $61,200 | $165,800 |
| 2024 | $7,618 | $227,000 | $61,200 | $165,800 |
| 2023 | $7,618 | $227,000 | $61,200 | $165,800 |
| 2022 | $7,350 | $227,000 | $61,200 | $165,800 |
| 2021 | $6,980 | $227,000 | $61,200 | $165,800 |
| 2020 | $6,948 | $227,000 | $61,200 | $165,800 |
| 2019 | $6,792 | $227,000 | $61,200 | $165,800 |
| 2018 | $6,672 | $227,000 | $61,200 | $165,800 |
| 2017 | $6,249 | $227,000 | $61,200 | $165,800 |
| 2016 | $6,099 | $227,000 | $61,200 | $165,800 |
| 2015 | $5,965 | $227,000 | $61,200 | $165,800 |
| 2014 | $5,736 | $227,000 | $61,200 | $165,800 |
Source: Public Records
Map
Nearby Homes