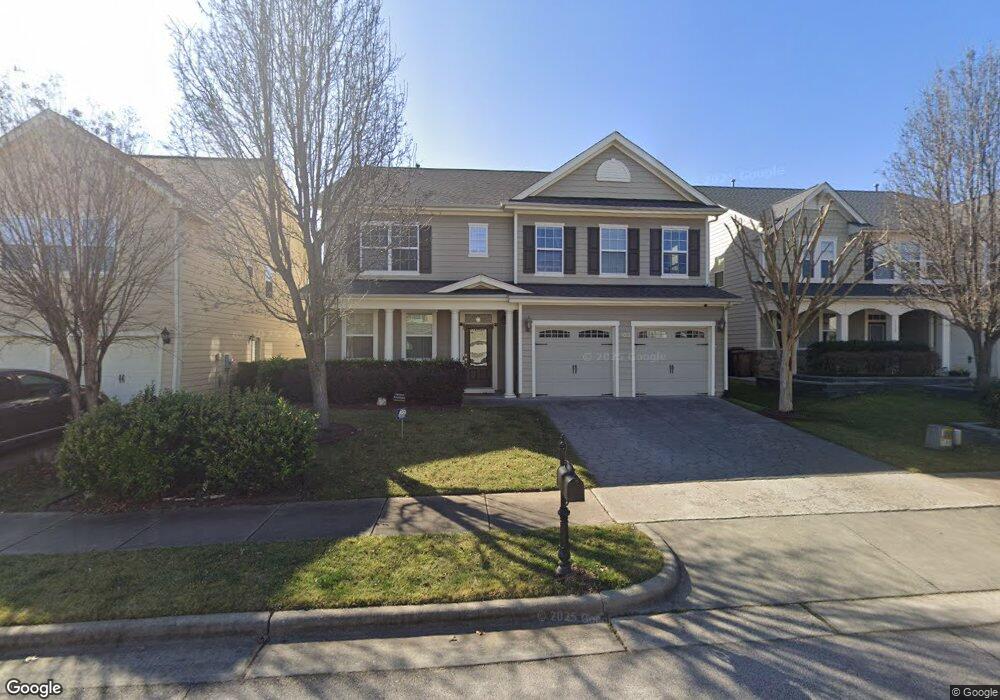
109 Deer Isle Ct Cary, NC 27519
Twin Lakes NeighborhoodEstimated Value: $741,421 - $805,000
Studio
3
Baths
3,743
Sq Ft
$209/Sq Ft
Est. Value
About This Home
This home is located at 109 Deer Isle Ct, Cary, NC 27519 and is currently estimated at $781,105, approximately $208 per square foot. 109 Deer Isle Ct is a home located in Wake County with nearby schools including Cedar Fork Elementary, West Cary Middle School, and Panther Creek High School.
Ownership History
Date
Name
Owned For
Owner Type
Purchase Details
Closed on
May 8, 2024
Sold by
Jain Subodh and Jain Richa
Bought by
Jain Living Trust and Jain
Current Estimated Value
Purchase Details
Closed on
Nov 30, 2009
Sold by
Parker & Orleans Homebuilders Inc
Bought by
Ganesan Sunil Kumar and Sunilkumar Mahalakshmi
Home Financials for this Owner
Home Financials are based on the most recent Mortgage that was taken out on this home.
Original Mortgage
$305,800
Interest Rate
4.94%
Mortgage Type
New Conventional
Purchase Details
Closed on
Sep 25, 2008
Sold by
Kb Home Raleigh Durham Inc
Bought by
Jain Subodh and Jain Richa
Home Financials for this Owner
Home Financials are based on the most recent Mortgage that was taken out on this home.
Original Mortgage
$285,529
Interest Rate
6.49%
Mortgage Type
Purchase Money Mortgage
Purchase Details
Closed on
May 21, 2008
Sold by
Sandler At Twin Lakes Llc
Bought by
Kb Home Raleigh Durham Inc
Create a Home Valuation Report for This Property
The Home Valuation Report is an in-depth analysis detailing your home's value as well as a comparison with similar homes in the area
Home Values in the Area
Average Home Value in this Area
Purchase History
| Date | Buyer | Sale Price | Title Company |
|---|---|---|---|
| Jain Living Trust | -- | None Listed On Document | |
| Jain Living Trust | -- | None Listed On Document | |
| Ganesan Sunil Kumar | $322,500 | None Available | |
| Jain Subodh | $357,000 | None Available | |
| Kb Home Raleigh Durham Inc | $877,500 | None Available |
Source: Public Records
Mortgage History
| Date | Status | Borrower | Loan Amount |
|---|---|---|---|
| Previous Owner | Ganesan Sunil Kumar | $305,800 | |
| Previous Owner | Jain Subodh | $285,529 |
Source: Public Records
Tax History
| Year | Tax Paid | Tax Assessment Tax Assessment Total Assessment is a certain percentage of the fair market value that is determined by local assessors to be the total taxable value of land and additions on the property. | Land | Improvement |
|---|---|---|---|---|
| 2025 | $6,256 | $727,612 | $180,000 | $547,612 |
| 2024 | $6,121 | $727,612 | $180,000 | $547,612 |
Source: Public Records
Map
Nearby Homes
- 605 Beech Hanger Dr
- 106 Honeycomb Ln
- 226 Leacroft Way
- 1329 Alemany St
- 105 Bayless Ridge Ct
- 316 Valley Glen Dr
- 548 Abbey Fields Loop
- 417 Downing Glen Dr
- 309 Malvern Hill Ln
- 313 Indian Branch Dr
- 1219 Foxglove Dr
- 3147 Rapid Falls Rd
- 1212 Checkerberry Dr Unit 34
- 11201 Jeremiah St
- 1116 Checkerberry Dr
- 108 Trumbell Cir
- 104 Ivy Tree Place
- 170 Point Comfort Ln
- 318 Madison Grove Place
- 406 Clementine Dr
- 111 Deer Isle Ct
- 107 Deer Isle Ct
- 105 Deer Isle Ct
- 113 Deer Isle Ct
- 108 Deer Isle Ct
- 6028 Lake Grove Blvd
- 203 Oceanside Ln
- 106 Deer Isle Ct
- 110 Deer Isle Ct
- 115 Deer Isle Ct
- 104 Deer Isle Ct
- 103 Deer Isle Ct
- 101 Deer Isle Ct
- 112 Deer Isle Ct
- 117 Deer Isle Ct
- 811 Tranquil Sound Dr
- 205 Oceanside Ln
- 114 Deer Isle Ct
- 907 Iverton Ln
- 116 Deer Isle Ct
Your Personal Tour Guide
Ask me questions while you tour the home.