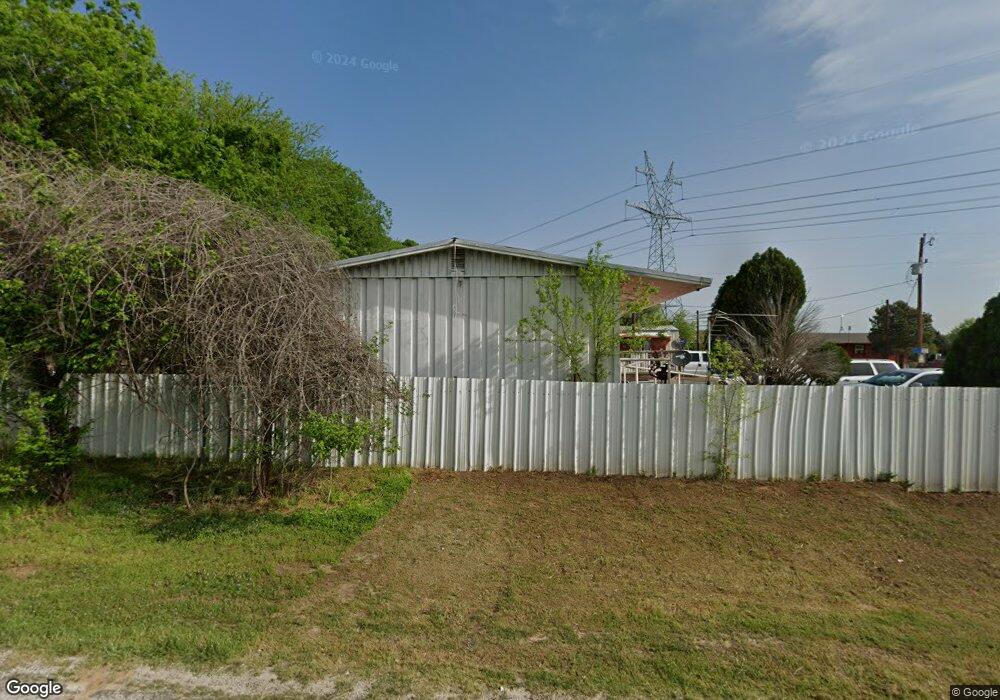
109 Dill Rd Weatherford, TX 76085
Estimated Value: $190,025 - $411,000
--
Bed
--
Bath
756
Sq Ft
$374/Sq Ft
Est. Value
About This Home
This home is located at 109 Dill Rd, Weatherford, TX 76085 and is currently estimated at $282,506, approximately $373 per square foot. 109 Dill Rd is a home located in Parker County with nearby schools including Crockett Elementary School, Tison Middle School, and Weatherford High School.
Ownership History
Date
Name
Owned For
Owner Type
Purchase Details
Closed on
Oct 25, 2013
Sold by
Westenhover Gary F and Cantrell William
Bought by
Olivas Raymond Caleb
Current Estimated Value
Home Financials for this Owner
Home Financials are based on the most recent Mortgage that was taken out on this home.
Original Mortgage
$22,000
Outstanding Balance
$6,370
Interest Rate
6.37%
Mortgage Type
Adjustable Rate Mortgage/ARM
Estimated Equity
$276,136
Purchase Details
Closed on
Feb 8, 2010
Sold by
Ellis Freddie M Etal
Bought by
Olivas Raymond Caleb
Purchase Details
Closed on
Feb 2, 2010
Sold by
Stone Billie and Ellis Sylvia
Bought by
Westenhover Gary F and Cantrell William
Purchase Details
Closed on
Jan 7, 2002
Sold by
Ellis Clyde and Ellis Ruby M
Bought by
Olivas Raymond Caleb
Create a Home Valuation Report for This Property
The Home Valuation Report is an in-depth analysis detailing your home's value as well as a comparison with similar homes in the area
Home Values in the Area
Average Home Value in this Area
Purchase History
| Date | Buyer | Sale Price | Title Company |
|---|---|---|---|
| Olivas Raymond Caleb | -- | None Available | |
| Olivas Raymond Caleb | -- | -- | |
| Westenhover Gary F | -- | None Available | |
| Westenhover Gary F | -- | None Available | |
| Olivas Raymond Caleb | -- | -- |
Source: Public Records
Mortgage History
| Date | Status | Borrower | Loan Amount |
|---|---|---|---|
| Open | Olivas Raymond Caleb | $22,000 |
Source: Public Records
Tax History Compared to Growth
Tax History
| Year | Tax Paid | Tax Assessment Tax Assessment Total Assessment is a certain percentage of the fair market value that is determined by local assessors to be the total taxable value of land and additions on the property. | Land | Improvement |
|---|---|---|---|---|
| 2025 | $3,097 | $174,050 | $129,020 | $45,030 |
| 2024 | $3,097 | $190,100 | $143,630 | $46,470 |
| 2023 | $3,097 | $190,100 | $143,630 | $46,470 |
| 2022 | $1,834 | $98,490 | $83,620 | $14,870 |
| 2021 | $1,984 | $98,490 | $83,620 | $14,870 |
| 2020 | $1,518 | $74,820 | $63,630 | $11,190 |
| 2019 | $1,619 | $74,820 | $63,630 | $11,190 |
| 2018 | $971 | $44,630 | $35,590 | $9,040 |
| 2017 | $991 | $44,630 | $35,590 | $9,040 |
| 2016 | $984 | $44,320 | $35,590 | $8,730 |
| 2015 | $967 | $44,320 | $35,590 | $8,730 |
| 2014 | $934 | $43,950 | $35,590 | $8,360 |
Source: Public Records
Map
Nearby Homes
- 265 Dill Rd
- 1040 Ray's Way
- TBD Murray Rd
- 4951 N Fm 51
- 5885-A Old Springtown Rd
- 5885-B Old Springtown Rd
- 5885-C Old Springtown Rd
- 5885-E Old Springtown Rd
- 5885-D Old Springtown Rd
- 2000 Collin St
- 1009 Sabrina Ct
- 1000 Rays Way
- 151 Kriston Ln
- 332 Water View Ln
- 342 Rising View Ct
- 143 Carter Hills Ln
- 134 Hedges Cir
- 5600 Weiland Rd
- 319 Denton Heights Ln
- 1060 Scott Rd