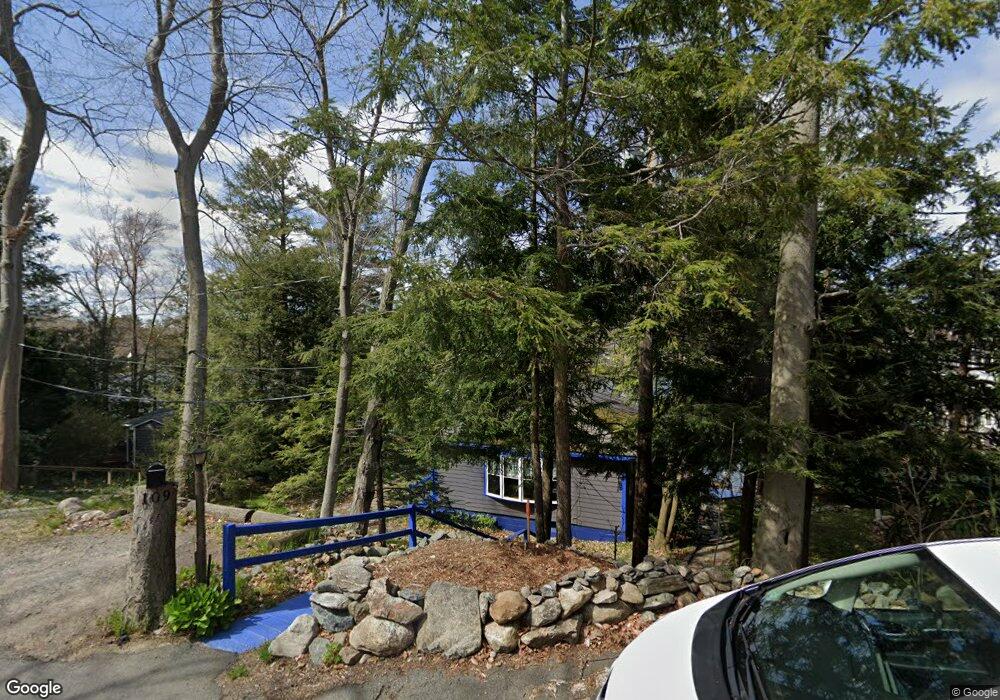
109 Dudley Rd Wayland, MA 01778
Estimated Value: $579,000 - $911,000
2
Beds
2
Baths
1,016
Sq Ft
$784/Sq Ft
Est. Value
About This Home
This home is located at 109 Dudley Rd, Wayland, MA 01778 and is currently estimated at $796,990, approximately $784 per square foot. 109 Dudley Rd is a home located in Middlesex County with nearby schools including Wayland High School, Christa McAuliffe Charter School, and Veritas Christian Academy.
Ownership History
Date
Name
Owned For
Owner Type
Purchase Details
Closed on
Nov 18, 2008
Sold by
Pollak Arlene B and Pollak Elliot S
Bought by
Kershaw David and Murray Maureen
Current Estimated Value
Home Financials for this Owner
Home Financials are based on the most recent Mortgage that was taken out on this home.
Original Mortgage
$100,000
Outstanding Balance
$65,804
Interest Rate
6.13%
Mortgage Type
Purchase Money Mortgage
Estimated Equity
$731,186
Purchase Details
Closed on
Jul 2, 2004
Sold by
Esp Rt
Bought by
Pollak Arlene B and Pollak Elliot S
Create a Home Valuation Report for This Property
The Home Valuation Report is an in-depth analysis detailing your home's value as well as a comparison with similar homes in the area
Home Values in the Area
Average Home Value in this Area
Purchase History
| Date | Buyer | Sale Price | Title Company |
|---|---|---|---|
| Kershaw David | $392,500 | -- | |
| Pollak Arlene B | -- | -- | |
| Kershaw David | $392,500 | -- | |
| Pollak Arlene B | -- | -- |
Source: Public Records
Mortgage History
| Date | Status | Borrower | Loan Amount |
|---|---|---|---|
| Open | Kershaw David | $100,000 | |
| Closed | Pollak Arlene B | $100,000 | |
| Previous Owner | Pollak Arlene B | $75,000 | |
| Previous Owner | Pollak Arlene B | $93,000 |
Source: Public Records
Tax History
| Year | Tax Paid | Tax Assessment Tax Assessment Total Assessment is a certain percentage of the fair market value that is determined by local assessors to be the total taxable value of land and additions on the property. | Land | Improvement |
|---|---|---|---|---|
| 2025 | $11,216 | $717,600 | $569,900 | $147,700 |
| 2024 | $10,613 | $683,800 | $542,700 | $141,100 |
| 2023 | $10,321 | $619,900 | $493,400 | $126,500 |
| 2022 | $9,370 | $510,600 | $381,700 | $128,900 |
| 2021 | $8,212 | $443,400 | $329,900 | $113,500 |
| 2020 | $7,138 | $401,900 | $293,300 | $108,600 |
| 2019 | $6,897 | $377,300 | $279,300 | $98,000 |
| 2018 | $6,700 | $371,600 | $279,300 | $92,300 |
| 2017 | $6,124 | $337,600 | $266,000 | $71,600 |
| 2016 | $5,764 | $332,400 | $260,800 | $71,600 |
| 2015 | $6,124 | $333,000 | $260,800 | $72,200 |
Source: Public Records
Map
Nearby Homes
- 108 Dudley Rd
- 123 Dudley Rd
- 26 Pine Ridge Rd
- 22 Pine Ridge Rd
- 225 W Plain St
- 186 Main St
- 45 W Plain St Unit 1
- 18 Brigati Terrace
- 1 Cole Rd
- 37 Davelin Rd
- 18 Jay Dr
- 136 Commonwealth Rd
- 5 Griffin Cir
- 218 Old Connecticut Path
- 189 Danforth St
- 33 Oak Hill Rd
- 226 Stonebridge Rd
- 2 Darby Ct
- 11 Danforth Park Rd
- 6 Brewster Rd
Your Personal Tour Guide
Ask me questions while you tour the home.