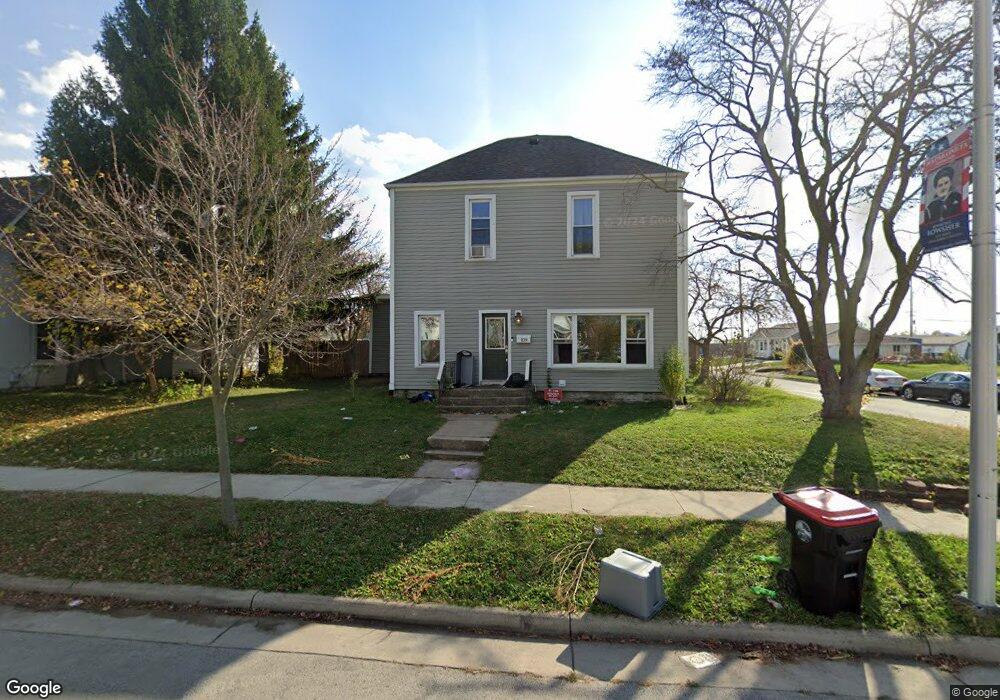
109 E Benton St Wapakoneta, OH 45895
Estimated Value: $192,016 - $211,000
4
Beds
2
Baths
2,144
Sq Ft
$92/Sq Ft
Est. Value
About This Home
This home is located at 109 E Benton St, Wapakoneta, OH 45895 and is currently estimated at $198,004, approximately $92 per square foot. 109 E Benton St is a home located in Auglaize County with nearby schools including Wapakoneta Elementary School, Wapakoneta High School, and Wapakoneta Middle School.
Ownership History
Date
Name
Owned For
Owner Type
Purchase Details
Closed on
Sep 6, 2018
Sold by
Mescher Greg L and Seal Julie A
Bought by
Kesler Justin Charles and Kesler Brianna R
Current Estimated Value
Home Financials for this Owner
Home Financials are based on the most recent Mortgage that was taken out on this home.
Original Mortgage
$136,881
Outstanding Balance
$119,122
Interest Rate
4.5%
Mortgage Type
VA
Estimated Equity
$78,882
Purchase Details
Closed on
Jul 6, 2006
Sold by
Beneficial Ohio Inc
Bought by
Mescher Greg L and Seals Julie A
Home Financials for this Owner
Home Financials are based on the most recent Mortgage that was taken out on this home.
Original Mortgage
$56,800
Interest Rate
6.72%
Mortgage Type
Purchase Money Mortgage
Purchase Details
Closed on
Dec 19, 2005
Sold by
Marker John A
Bought by
Beneficial Ohio Inc and Beneficial Mortgage Co
Create a Home Valuation Report for This Property
The Home Valuation Report is an in-depth analysis detailing your home's value as well as a comparison with similar homes in the area
Home Values in the Area
Average Home Value in this Area
Purchase History
| Date | Buyer | Sale Price | Title Company |
|---|---|---|---|
| Kesler Justin Charles | $134,000 | None Available | |
| Mescher Greg L | $41,000 | None Available | |
| Beneficial Ohio Inc | -- | None Available |
Source: Public Records
Mortgage History
| Date | Status | Borrower | Loan Amount |
|---|---|---|---|
| Open | Kesler Justin Charles | $136,881 | |
| Closed | Mescher Greg L | $56,800 |
Source: Public Records
Tax History Compared to Growth
Tax History
| Year | Tax Paid | Tax Assessment Tax Assessment Total Assessment is a certain percentage of the fair market value that is determined by local assessors to be the total taxable value of land and additions on the property. | Land | Improvement |
|---|---|---|---|---|
| 2024 | $2,432 | $49,880 | $12,590 | $37,290 |
| 2023 | $1,631 | $49,880 | $12,590 | $37,290 |
| 2022 | $1,415 | $39,960 | $11,500 | $28,460 |
| 2021 | $1,395 | $39,960 | $11,500 | $28,460 |
| 2020 | $775 | $39,960 | $11,498 | $28,462 |
| 2019 | $1,332 | $32,813 | $9,443 | $23,370 |
| 2018 | $1,341 | $32,813 | $9,443 | $23,370 |
| 2017 | $1,335 | $32,813 | $9,443 | $23,370 |
| 2016 | $1,113 | $26,573 | $8,943 | $17,630 |
| 2015 | $1,106 | $26,573 | $8,943 | $17,630 |
| 2014 | $1,121 | $26,573 | $8,943 | $17,630 |
| 2013 | $1,143 | $26,573 | $8,943 | $17,630 |
Source: Public Records
Map
Nearby Homes