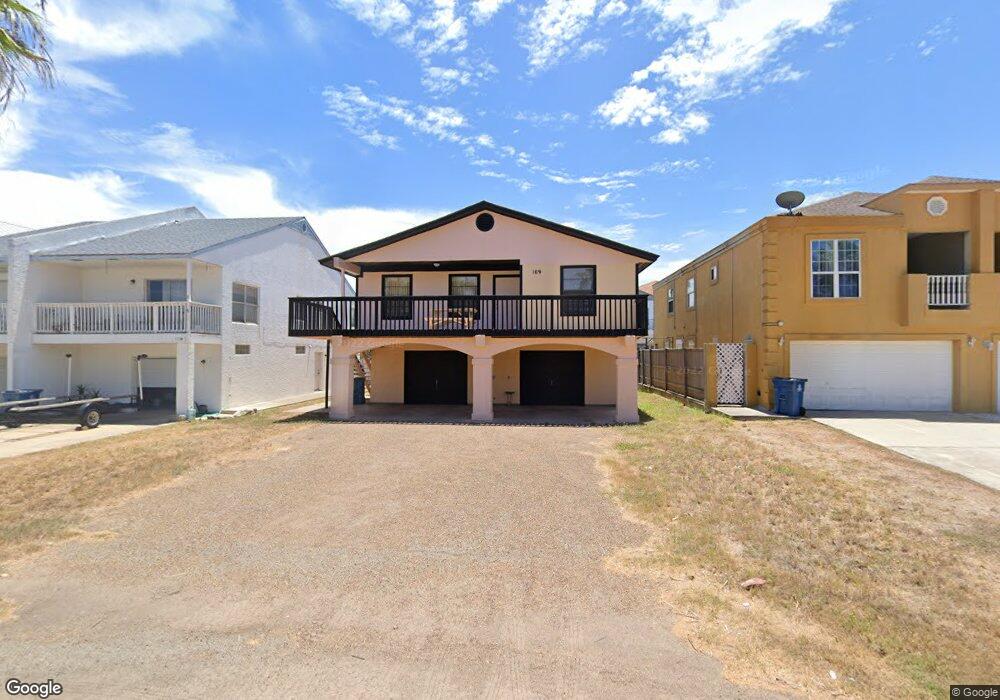
109 E Cora Lee Dr Unit 7 South Padre Island, TX 78597
Estimated Value: $375,000 - $802,000
3
Beds
3
Baths
1,522
Sq Ft
$321/Sq Ft
Est. Value
About This Home
This home is located at 109 E Cora Lee Dr Unit 7, South Padre Island, TX 78597 and is currently estimated at $488,239, approximately $320 per square foot. 109 E Cora Lee Dr Unit 7 is a home located in Cameron County with nearby schools including Garriga Elementary School, Derry Elementary School, and Port Isabel Junior High School.
Ownership History
Date
Name
Owned For
Owner Type
Purchase Details
Closed on
Jan 10, 2023
Sold by
Mohammed Hindatu and Siegel Michael
Bought by
3A Ml Investments Llc
Current Estimated Value
Purchase Details
Closed on
Apr 6, 2021
Sold by
Partida Juan R and Partida Felicia
Bought by
Mohammed Hindatu and Siegel Michael
Home Financials for this Owner
Home Financials are based on the most recent Mortgage that was taken out on this home.
Original Mortgage
$184,000
Interest Rate
2.9%
Mortgage Type
New Conventional
Purchase Details
Closed on
Oct 20, 2010
Sold by
Garth Investments Lp
Bought by
Partida Juan R
Home Financials for this Owner
Home Financials are based on the most recent Mortgage that was taken out on this home.
Original Mortgage
$89,600
Interest Rate
4.38%
Mortgage Type
New Conventional
Create a Home Valuation Report for This Property
The Home Valuation Report is an in-depth analysis detailing your home's value as well as a comparison with similar homes in the area
Home Values in the Area
Average Home Value in this Area
Purchase History
| Date | Buyer | Sale Price | Title Company |
|---|---|---|---|
| 3A Ml Investments Llc | -- | Rio Grande Valley Abstract | |
| Mohammed Hindatu | -- | New Title Company Name | |
| Partida Juan R | -- | Vltc |
Source: Public Records
Mortgage History
| Date | Status | Borrower | Loan Amount |
|---|---|---|---|
| Previous Owner | Mohammed Hindatu | $184,000 | |
| Previous Owner | Partida Juan R | $89,600 |
Source: Public Records
Tax History Compared to Growth
Tax History
| Year | Tax Paid | Tax Assessment Tax Assessment Total Assessment is a certain percentage of the fair market value that is determined by local assessors to be the total taxable value of land and additions on the property. | Land | Improvement |
|---|---|---|---|---|
| 2025 | $5,965 | $361,893 | $65,570 | $296,323 |
| 2024 | $5,965 | $365,299 | $65,570 | $299,729 |
| 2023 | $6,264 | $365,390 | $62,250 | $303,140 |
| 2022 | $5,017 | $268,976 | $41,500 | $227,476 |
| 2021 | $4,639 | $230,683 | $31,125 | $199,558 |
| 2020 | $4,055 | $200,250 | $43,575 | $156,675 |
| 2019 | $4,135 | $200,250 | $43,575 | $156,675 |
| 2018 | $4,132 | $200,250 | $43,575 | $156,675 |
| 2017 | $4,100 | $200,250 | $43,575 | $156,675 |
| 2016 | $4,100 | $200,250 | $43,575 | $156,675 |
| 2015 | $3,997 | $200,250 | $43,575 | $156,675 |
Source: Public Records
Map
Nearby Homes
- 6410 Padre Blvd Unit 103
- 6410 Padre Blvd Unit 302
- 6410 Padre Blvd Unit 107
- 6410 Padre Blvd Unit 204
- 6410 Padre Blvd Unit 108
- 6410 Padre Blvd Unit 101
- 6410 Padre Blvd Unit 104
- 109 W Cora Lee Dr Unit 10
- 109 W Cora Lee Dr Unit 9
- 5309 Padre Blvd Unit 6
- lot11&12 E Cora Lee Dr Unit 11&12
- 103 E Georgia Ruth Dr Unit 2D
- 103 E Georgia Ruth Dr
- 308 E Morningside Dr Unit 210
- LOT 4A W Carolyn Dr
- 5200 Padre Blvd Unit 1-3
- 104 E Verna Jean Dr Unit 102
- 115 E Georgia Ruth Dr Unit A
- 111 E Morningside Dr Unit 104
- 111 E Morningside Dr Unit 209
- 109 E Cora Lee Dr
- 109 E Cora Lee Dr
- 109 W Cora Lee Dr Unit 1
- 109 W Cora Lee Dr Unit 2
- 109 W Cora Lee Dr Unit 12
- 109 W Cora Lee Dr Unit 14
- 109 W Cora Lee Dr Unit 5
- 109 E Cora Lee Dr Unit 13
- 109 E Cora Lee Dr Unit 1
- 109 W Cora Lee Dr Unit 7
- 109 E Cora Lee Dr Unit 12
- 109 W Cora Lee Dr Unit 11
- 109 W Cora Lee Dr Unit 13
- 109 W Cora Lee Dr
- 109 E Cora Lee Dr Unit 6
- 109 E Cora Lee Dr Unit 4
- 109 E Cora Lee Dr Unit 11
- 109 E Cora Lee Dr Unit 14
- 109 E Cora Lee Dr Unit 10
- 111 E 111b