109 E Main St Manchester, TN 37355
Estimated Value: $246,000 - $274,000
About This Home
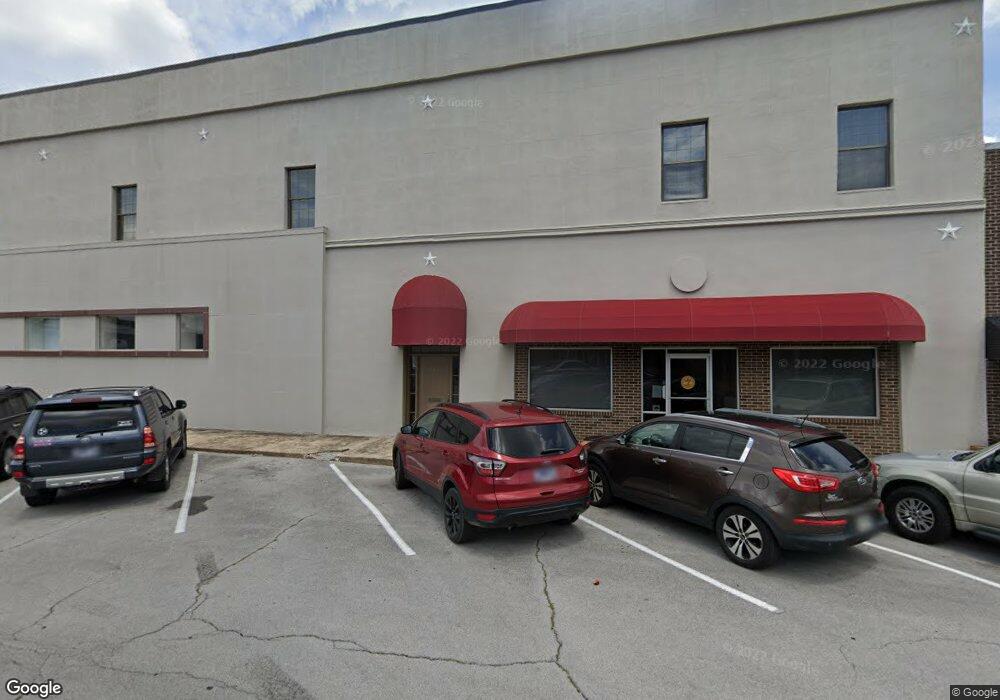
This home is located at 109 E Main St, Manchester, TN 37355 and is currently estimated at $259,436, approximately $136 per square foot. 109 E Main St is a home located in Coffee County with nearby schools including Westwood Middle School and Temple Baptist Christian School.
Ownership History
We collect this data history from publicly available records. To have your information removed, we recommend requesting removal directly through your county’s website.
Purchase Details
Home Financials for this Owner
Home Financials are based on the most recent Mortgage that was taken out on this home.Purchase Details
Home Values in the Area
Average Home Value in this Area
Purchase History
We collect this data history from publicly available records. To have your information removed, we recommend requesting removal directly through your county’s website.
| Date | Buyer | Sale Price | Title Company |
|---|---|---|---|
| $250,000 | None Listed On Document | ||
| $12,449 | None Available |
Mortgage History
We collect this data history from publicly available records. To have your information removed, we recommend requesting removal directly through your county’s website.
| Date | Status | Borrower | Loan Amount |
|---|---|---|---|
| Open | $700,000 |
Tax History
We collect this data history from publicly available records. To have your information removed, we recommend requesting removal directly through your county’s website.
| Year | Tax Paid | Tax Assessment Tax Assessment Total Assessment is a certain percentage of the fair market value that is determined by local assessors to be the total taxable value of land and additions on the property. | Land | Improvement |
|---|---|---|---|---|
| 2025 | $1,554 | $36,880 | $4,000 | $32,880 |
| 2024 | $1,554 | $36,880 | $4,000 | $32,880 |
| 2023 | $1,554 | $36,880 | $0 | $0 |
| 2022 | $1,338 | $36,880 | $4,000 | $32,880 |
| 2021 | $612 | $13,350 | $2,500 | $10,850 |
| 2020 | $612 | $13,350 | $2,500 | $10,850 |
| 2019 | $612 | $13,350 | $2,500 | $10,850 |
| 2018 | $612 | $13,350 | $2,500 | $10,850 |
| 2017 | $589 | $11,225 | $2,500 | $8,725 |
| 2016 | $589 | $11,225 | $2,500 | $8,725 |
| 2015 | $589 | $11,225 | $2,500 | $8,725 |
| 2014 | $589 | $11,230 | $0 | $0 |
Map
- 201 E Mclean St
- 305 S Irwin St
- 612 Maple St
- 321 W Short St
- 728 S Spring St
- 725 Mill St
- 0 W Coffee St
- 261 Hillcrest Rd
- 401 Hillcrest Rd
- 917 Madison St
- 69 Laurel View St
- 27 Laurel View St
- 37 Laurel View St
- 1205 Sycamore Dr
- 603 Johnson St
- 1006 Evins St
- 506 Johnson St
- 282 Hunt St
- 1006 Remington Place
- 1301 Sycamore Dr
- 104 E Main St
- 112 E Main St
- 119 S Spring St
- 100 N Spring St
- 101 W Main St
- 108 N Spring St
- 113 W Main St Unit 111
- 113 W Main St
- 108 N Spring St
- 111 W Main St
- 108 W Mclean St
- 117 W Main St
- 118 N Spring St
- 133 E Main St
- 119 S Irwin St
- 109 Bluegrass Rd
- 200 S Woodland St
- 115 N Woodland St
- 103 Hillsboro Blvd
- 107 Hillsboro Blvd
Ask me questions while you tour the home.