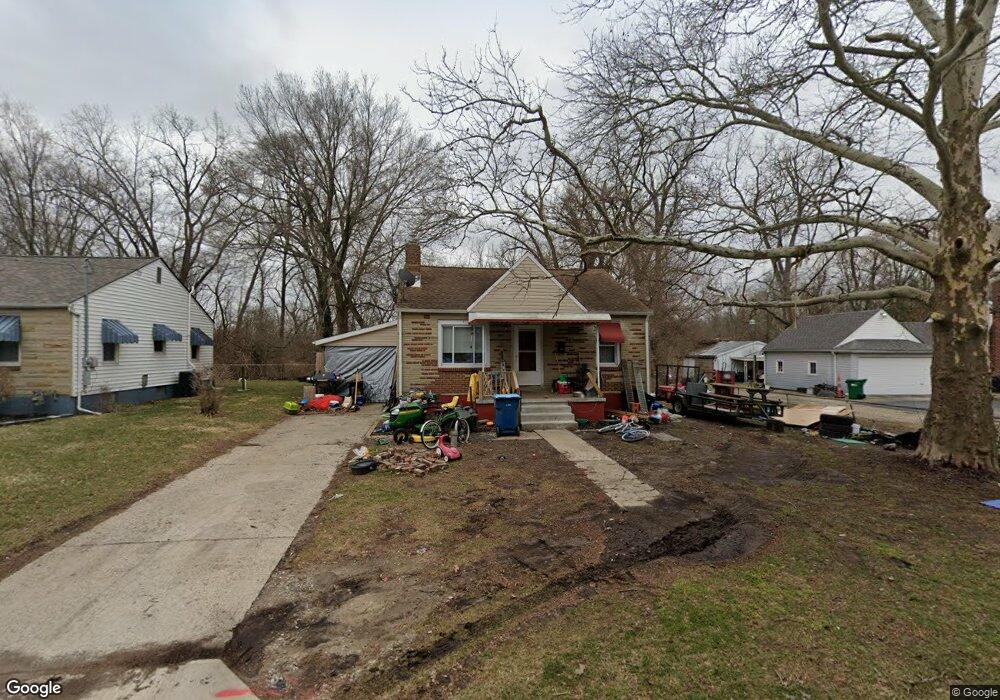
109 E Main St Medway, OH 45341
Estimated Value: $133,199 - $170,000
2
Beds
1
Bath
896
Sq Ft
$178/Sq Ft
Est. Value
About This Home
This home is located at 109 E Main St, Medway, OH 45341 and is currently estimated at $159,800, approximately $178 per square foot. 109 E Main St is a home located in Clark County with nearby schools including Park Layne Elementary School, Donnelsville Elementary School, and New Carlisle Elementary School.
Ownership History
Date
Name
Owned For
Owner Type
Purchase Details
Closed on
Nov 14, 2017
Sold by
Groff John Daniel
Bought by
Kain Randal and Kain Richard
Current Estimated Value
Purchase Details
Closed on
Apr 20, 2000
Sold by
Mccarty Timothy D and Mccarty Gladys M
Bought by
Kain Richard Roy
Home Financials for this Owner
Home Financials are based on the most recent Mortgage that was taken out on this home.
Original Mortgage
$73,900
Interest Rate
8.22%
Mortgage Type
Purchase Money Mortgage
Purchase Details
Closed on
Jun 24, 1993
Create a Home Valuation Report for This Property
The Home Valuation Report is an in-depth analysis detailing your home's value as well as a comparison with similar homes in the area
Home Values in the Area
Average Home Value in this Area
Purchase History
| Date | Buyer | Sale Price | Title Company |
|---|---|---|---|
| Kain Randal | $7,200 | None Available | |
| Kain Richard Roy | $73,900 | -- | |
| -- | -- | -- |
Source: Public Records
Mortgage History
| Date | Status | Borrower | Loan Amount |
|---|---|---|---|
| Previous Owner | Kain Richard Roy | $73,900 |
Source: Public Records
Tax History
| Year | Tax Paid | Tax Assessment Tax Assessment Total Assessment is a certain percentage of the fair market value that is determined by local assessors to be the total taxable value of land and additions on the property. | Land | Improvement |
|---|---|---|---|---|
| 2025 | $8,265 | $43,870 | $9,620 | $34,250 |
| 2024 | $12,385 | $35,590 | $8,800 | $26,790 |
| 2023 | $9,915 | $35,590 | $8,800 | $26,790 |
| 2022 | $15,208 | $35,590 | $8,800 | $26,790 |
| 2021 | $2,530 | $27,530 | $6,420 | $21,110 |
| 2020 | $1,466 | $27,530 | $6,420 | $21,110 |
| 2019 | $1,961 | $27,530 | $6,420 | $21,110 |
| 2018 | $1,748 | $23,680 | $7,260 | $16,420 |
| 2017 | $1,715 | $24,273 | $7,263 | $17,010 |
| 2016 | $1,717 | $24,273 | $7,263 | $17,010 |
| 2015 | $3,203 | $23,825 | $7,263 | $16,562 |
| 2014 | $1,356 | $23,825 | $7,263 | $16,562 |
| 2013 | $3,642 | $23,825 | $7,263 | $16,562 |
Source: Public Records
Map
Nearby Homes
- 20 Fair Ave
- 500 Beach Dr
- 221 Lakeshore Dr
- 1885 Lake Rd
- 863 Portland Ave
- 321 Rosewood Rd
- 922 Styer Dr
- 308 Frayne Dr
- 1037 Frayne Dr
- 745 Hedwick St
- 819 Hedwick St
- 1134 Frayne Dr
- 1122 Chalet Ave
- 1226 Wendall Ave
- 1227 Frayne Dr
- 1243 Klose Ave
- 831 Weinland Dr
- 11591 Lower Valley Pike
- 842 Edgewick Rd
- 1729 Hocker Ave
Your Personal Tour Guide
Ask me questions while you tour the home.