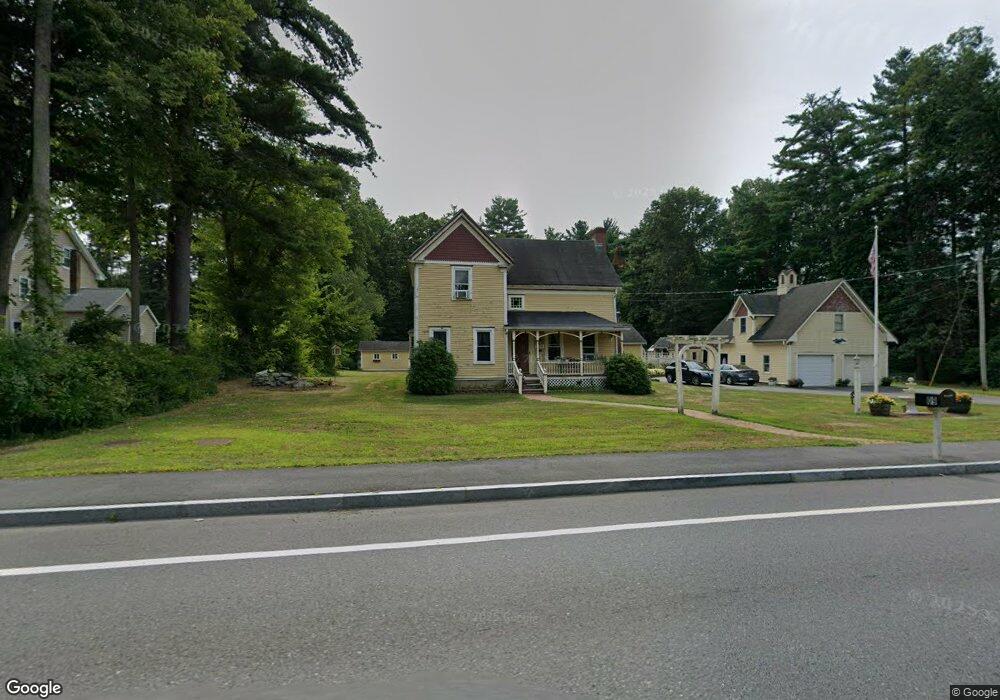
109 E Main St Norton, MA 02766
Estimated Value: $558,000 - $849,000
About This Home
This home is located at 109 E Main St, Norton, MA 02766 and is currently estimated at $714,444, approximately $242 per square foot. 109 E Main St is a home located in Bristol County with nearby schools including J.C. Solmonese Elementary School, Henri A. Yelle Elementary School, and Norton Middle School.
Ownership History
We collect this data history from publicly available records. To have your information removed, we recommend requesting removal directly through your county’s website.
Purchase Details
Purchase Details
Home Financials for this Owner
Home Financials are based on the most recent Mortgage that was taken out on this home.Purchase Details
Home Values in the Area
Average Home Value in this Area
Purchase History
We collect this data history from publicly available records. To have your information removed, we recommend requesting removal directly through your county’s website.
| Date | Buyer | Sale Price | Title Company |
|---|---|---|---|
| -- | -- | ||
| $120,000 | -- | ||
| $50,000 | -- |
Mortgage History
We collect this data history from publicly available records. To have your information removed, we recommend requesting removal directly through your county’s website.
| Date | Status | Borrower | Loan Amount |
|---|---|---|---|
| Previous Owner | $75,000 | ||
| Previous Owner | $75,000 | ||
| Previous Owner | $75,000 | ||
| Previous Owner | $45,000 |
Tax History
We collect this data history from publicly available records. To have your information removed, we recommend requesting removal directly through your county’s website.
| Year | Tax Paid | Tax Assessment Tax Assessment Total Assessment is a certain percentage of the fair market value that is determined by local assessors to be the total taxable value of land and additions on the property. | Land | Improvement |
|---|---|---|---|---|
| 2025 | $76 | $588,400 | $150,100 | $438,300 |
| 2024 | $7,279 | $562,100 | $142,900 | $419,200 |
| 2023 | $6,912 | $532,100 | $134,800 | $397,300 |
| 2022 | $6,684 | $468,700 | $122,500 | $346,200 |
| 2021 | $257 | $439,600 | $131,300 | $308,300 |
| 2020 | $258 | $428,100 | $127,500 | $300,600 |
| 2019 | $248 | $413,400 | $122,600 | $290,800 |
| 2018 | $5,968 | $393,700 | $122,600 | $271,100 |
| 2017 | $244 | $401,000 | $136,300 | $264,700 |
| 2016 | $5,949 | $381,100 | $136,300 | $244,800 |
| 2015 | $5,734 | $372,600 | $133,600 | $239,000 |
| 2014 | $5,300 | $344,800 | $114,500 | $230,300 |
Map
- 12 Talbot Dr
- 2 Elm St
- 195 E Main St
- 29 Germain Way Unit 3
- 27 Germain Way Unit 4
- 16 Lloyd Cir Unit 30
- 42 Alder Rd
- 21 Cobb St
- 43 Alder Rd
- 13 Lloyd Cir Unit 38
- 0 Brook Pkwy
- 0 Cobb St
- 39 Evergreen Rd
- 283 E Main St Unit 34
- 298 Reservoir St
- 1 Wilbur Terrace Unit 6
- 88 Newcomb St
- Lot 3B Hill St
- 53 Hill St
- 15 Downing Dr
Ask me questions while you tour the home.