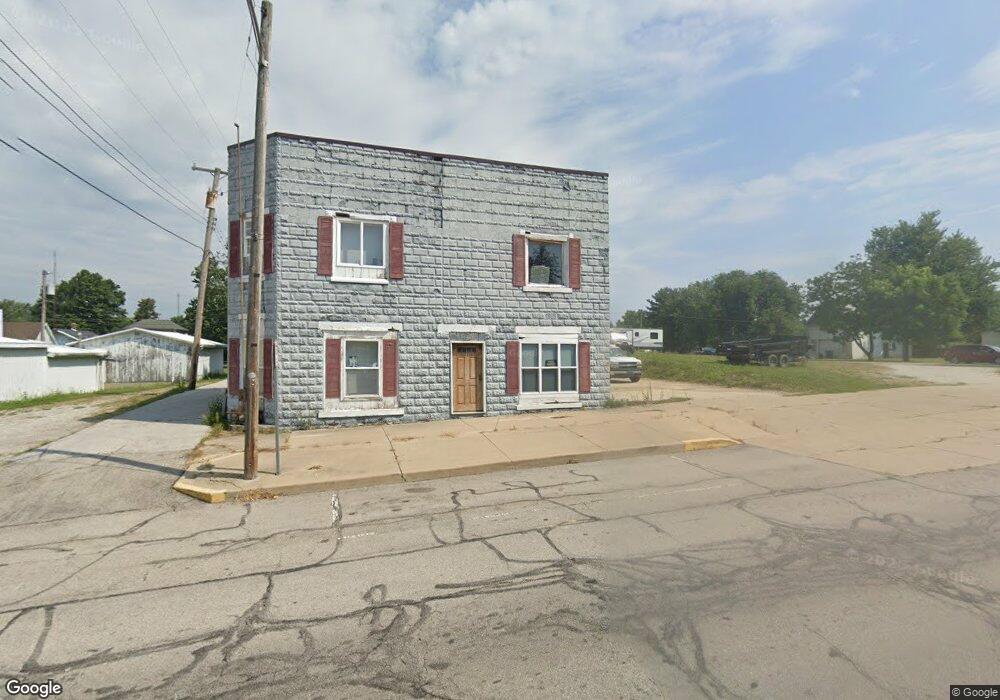
109 E Main St Silver Lake, IN 46982
Estimated Value: $78,675
Studio
--
Bath
1,704
Sq Ft
$46/Sq Ft
Est. Value
About This Home
This home is located at 109 E Main St, Silver Lake, IN 46982 and is currently priced at $78,675, approximately $46 per square foot. 109 E Main St is a home located in Kosciusko County with nearby schools including Claypool Elementary School, Edgewood Middle School, and Warsaw Community High School.
Ownership History
Date
Name
Owned For
Owner Type
Purchase Details
Closed on
Aug 18, 2023
Sold by
Dilon Lonnie
Bought by
Burkett Jaime D
Current Estimated Value
Home Financials for this Owner
Home Financials are based on the most recent Mortgage that was taken out on this home.
Original Mortgage
$76,245
Outstanding Balance
$57,283
Interest Rate
6.96%
Mortgage Type
New Conventional
Purchase Details
Closed on
May 29, 2020
Sold by
Manns Marcella and Dillon Marcella
Bought by
Dillon Lonnie
Purchase Details
Closed on
Aug 21, 2018
Sold by
Blocher George L
Bought by
Dillon Lonnie J and Dillon Marcella J
Home Financials for this Owner
Home Financials are based on the most recent Mortgage that was taken out on this home.
Original Mortgage
$45,000
Interest Rate
4.5%
Mortgage Type
Future Advance Clause Open End Mortgage
Purchase Details
Closed on
Aug 1, 2001
Sold by
Henderson Amy M
Bought by
Henderson Steven S
Purchase Details
Closed on
May 18, 2000
Sold by
Wayne Leiter and Tbe Bernadine
Bought by
Henderson Amy
Create a Home Valuation Report for This Property
The Home Valuation Report is an in-depth analysis detailing your home's value as well as a comparison with similar homes in the area
Purchase History
| Date | Buyer | Sale Price | Title Company |
|---|---|---|---|
| Burkett Jaime D | $75,000 | Fidelity National Title | |
| Dillon Lonnie | -- | None Available | |
| Dillon Lonnie J | -- | None Available | |
| Henderson Steven S | -- | -- | |
| Henderson Amy | $20,000 | -- |
Source: Public Records
Mortgage History
| Date | Status | Borrower | Loan Amount |
|---|---|---|---|
| Open | Burkett Jaime D | $76,245 | |
| Previous Owner | Dillon Lonnie J | $45,000 |
Source: Public Records
Tax History
| Year | Tax Paid | Tax Assessment Tax Assessment Total Assessment is a certain percentage of the fair market value that is determined by local assessors to be the total taxable value of land and additions on the property. | Land | Improvement |
|---|---|---|---|---|
| 2024 | $2,039 | $80,700 | $23,500 | $57,200 |
| 2023 | $1,121 | $40,800 | $21,200 | $19,600 |
| 2022 | $1,120 | $40,400 | $21,200 | $19,200 |
| 2021 | $1,090 | $38,500 | $21,200 | $17,300 |
| 2020 | $1,122 | $38,900 | $21,600 | $17,300 |
| 2019 | $1,103 | $39,500 | $21,900 | $17,600 |
| 2018 | $1,094 | $38,300 | $21,000 | $17,300 |
| 2017 | $1,050 | $38,800 | $21,600 | $17,200 |
| 2016 | $2,249 | $81,100 | $21,200 | $59,900 |
| 2014 | $1,854 | $73,100 | $20,400 | $52,700 |
| 2013 | $1,854 | $71,700 | $20,000 | $51,700 |
Source: Public Records
Map
Nearby Homes
- 36.65 Acres Indiana 14
- 107 E Sycamore St
- 408 E Sycamore St
- 11184 S 250 W
- 706 W Neher Rd
- 1016 S Roosevelt St
- 8727 S Hill Dr
- 7404 W 1400 N
- 5439 W Warren St
- 5925 W 850 S
- 7180 S 425 W
- 102 S Main St
- 1862 County Road 1600 E
- 12930 N Bonestead Rd
- 9716 S 750 W
- 14455 E 100 S
- E St Rd 14
- 12081 N State Road 15
- TBD Lakeshore Dr
- 0 Lakeshore Dr
Your Personal Tour Guide
Ask me questions while you tour the home.