Estimated Value: $131,910 - $359,000
Studio
1
Bath
1,058
Sq Ft
$192/Sq Ft
Est. Value
About This Home
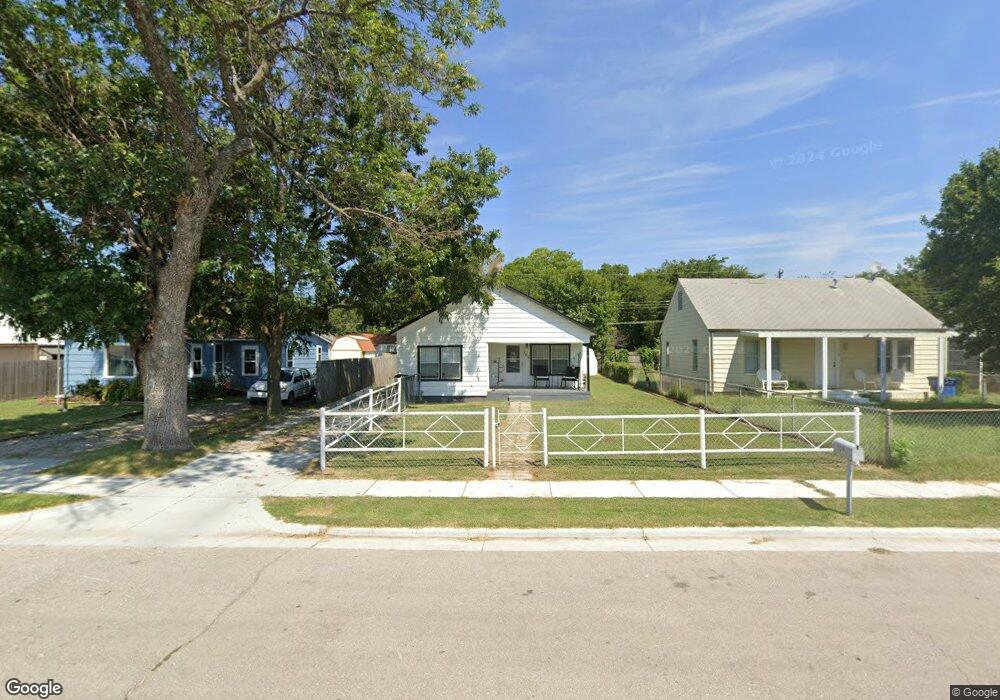
This home is located at 109 E Needles Ave, Bixby, OK 74008 and is currently estimated at $202,728, approximately $191 per square foot. 109 E Needles Ave is a home located in Tulsa County with nearby schools including Central Elementary School, Bixby Central Intermediate School, and Bixby Middle School.
Ownership History
Date
Name
Owned For
Owner Type
Purchase Details
Closed on
Apr 3, 2008
Sold by
Santoyo Debbie S and Santoyo Garcia Jaime
Bought by
Bixby Real Estate Investments Llc
Current Estimated Value
Purchase Details
Closed on
Jul 13, 2007
Sold by
Stealer Erica and Stealer Rodger
Bought by
Santoyo Debbie S
Home Financials for this Owner
Home Financials are based on the most recent Mortgage that was taken out on this home.
Original Mortgage
$76,396
Interest Rate
6.54%
Mortgage Type
FHA
Purchase Details
Closed on
May 19, 2003
Sold by
Stevenson Cash and Stevenson Noreena
Bought by
Stealer Erica and Stealer Rodger
Home Financials for this Owner
Home Financials are based on the most recent Mortgage that was taken out on this home.
Original Mortgage
$47,300
Interest Rate
5.79%
Mortgage Type
Purchase Money Mortgage
Create a Home Valuation Report for This Property
The Home Valuation Report is an in-depth analysis detailing your home's value as well as a comparison with similar homes in the area
Home Values in the Area
Average Home Value in this Area
Purchase History
| Date | Buyer | Sale Price | Title Company |
|---|---|---|---|
| Bixby Real Estate Investments Llc | $84,000 | None Available | |
| Santoyo Debbie S | $77,000 | None Available | |
| Stealer Erica | $60,000 | -- |
Source: Public Records
Mortgage History
| Date | Status | Borrower | Loan Amount |
|---|---|---|---|
| Previous Owner | Santoyo Debbie S | $76,396 | |
| Previous Owner | Stealer Erica | $47,300 |
Source: Public Records
Tax History
| Year | Tax Paid | Tax Assessment Tax Assessment Total Assessment is a certain percentage of the fair market value that is determined by local assessors to be the total taxable value of land and additions on the property. | Land | Improvement |
|---|---|---|---|---|
| 2025 | $1,395 | $10,175 | $1,632 | $8,543 |
| 2024 | $1,291 | $9,690 | $1,811 | $7,879 |
| 2023 | $1,291 | $9,229 | $2,200 | $7,029 |
| 2022 | $1,532 | $10,900 | $2,193 | $8,707 |
| 2021 | $1,363 | $10,381 | $2,089 | $8,292 |
| 2020 | $1,307 | $9,886 | $1,153 | $8,733 |
| 2019 | $1,311 | $9,886 | $1,153 | $8,733 |
| 2018 | $1,299 | $9,886 | $1,153 | $8,733 |
| 2017 | $1,291 | $9,886 | $1,153 | $8,733 |
| 2016 | $1,275 | $9,886 | $1,153 | $8,733 |
| 2015 | $1,197 | $9,886 | $1,153 | $8,733 |
| 2014 | $1,138 | $9,240 | $1,078 | $8,162 |
Source: Public Records
Map
Nearby Homes
- 7245 E 154th St S
- 6621 E 153rd St S
- 408 N Armstrong St
- 7220 E 154th Place S
- 3421 E 153rd St S
- 17670 S Yale Ave
- 204 N Grant St
- 016847 S Memorial Dr
- 5512 E 124th St S
- 10007 E 135th St S
- 10001 E 135th St S
- 9903 E 135th St S
- 9921 E 135th St S
- 7548 E 156th Place S
- 7525 E 156th Place S
- 3400 E 151st St S
- 3350 E 151st St S
- 7519 E 156th Place S
- 7536 E 156th Place S
- 7530 E 156th Place S
- 113 E Needles Ave
- 105 E Needles Ave
- 119 E Needles Ave
- 118 E McKennon Ave
- 123 E Needles Ave
- 106 E McKennon Ave
- 120 E Mckinnon
- 120 E McKennon Ave
- 110 E Needles Ave
- 112 E Needles Ave
- 106 E Needles Ave
- 127 E Needles Ave
- 120 E Needles Ave
- 122 E McKennon Ave
- 124 E Needles Ave
- 126 E McKennon Ave
- 126 E Needles Ave
- 203 E Needles Ave
- 109 E McKennon Ave
- 103 E McKennon Ave
Your Personal Tour Guide
Ask me questions while you tour the home.