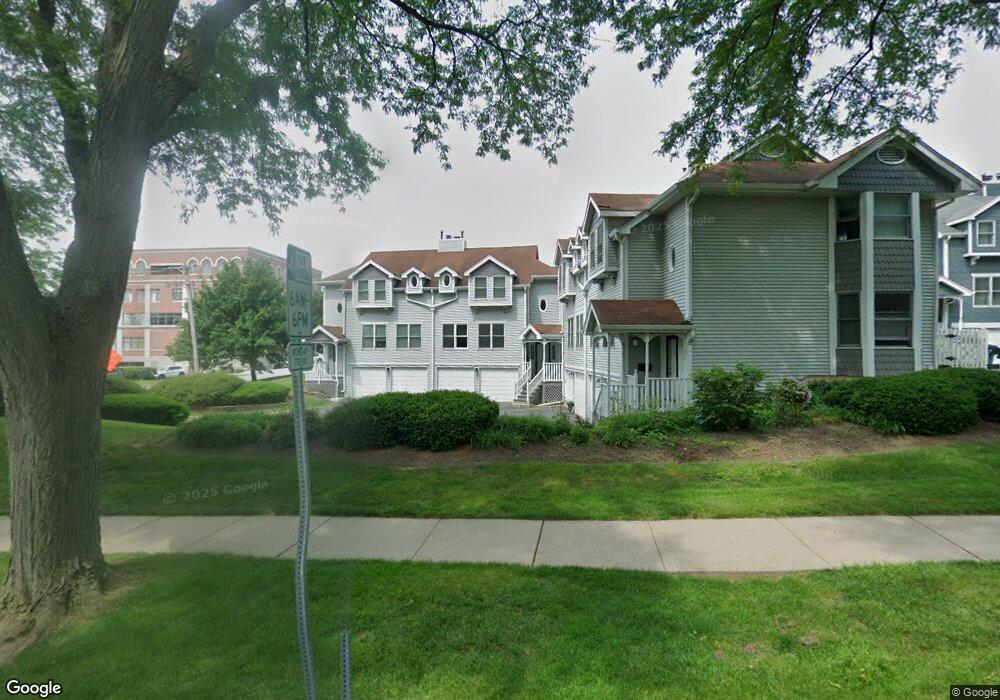
109 E Orchard St Elmhurst, IL 60126
Estimated Value: $1,570,501 - $1,873,000
--
Bed
--
Bath
3,960
Sq Ft
$430/Sq Ft
Est. Value
About This Home
This home is located at 109 E Orchard St, Elmhurst, IL 60126 and is currently estimated at $1,702,625, approximately $429 per square foot. 109 E Orchard St is a home located in DuPage County with nearby schools including Ravenswood Elementary School, Ruggles Elementary School, and Edison Elementary School.
Ownership History
Date
Name
Owned For
Owner Type
Purchase Details
Closed on
Nov 1, 2002
Sold by
Rob Lyn Construction
Bought by
Mcclary Colin J and Mcclary Amy G
Current Estimated Value
Home Financials for this Owner
Home Financials are based on the most recent Mortgage that was taken out on this home.
Original Mortgage
$715,940
Outstanding Balance
$288,381
Interest Rate
5.5%
Estimated Equity
$1,414,244
Purchase Details
Closed on
Sep 20, 1999
Sold by
Barnes John C
Bought by
Rob Lynn Construction
Create a Home Valuation Report for This Property
The Home Valuation Report is an in-depth analysis detailing your home's value as well as a comparison with similar homes in the area
Home Values in the Area
Average Home Value in this Area
Purchase History
| Date | Buyer | Sale Price | Title Company |
|---|---|---|---|
| Mcclary Colin J | $880,000 | Chicago Title | |
| Rob Lynn Construction | $255,000 | -- |
Source: Public Records
Mortgage History
| Date | Status | Borrower | Loan Amount |
|---|---|---|---|
| Open | Mcclary Colin J | $715,940 |
Source: Public Records
Tax History Compared to Growth
Tax History
| Year | Tax Paid | Tax Assessment Tax Assessment Total Assessment is a certain percentage of the fair market value that is determined by local assessors to be the total taxable value of land and additions on the property. | Land | Improvement |
|---|---|---|---|---|
| 2024 | -- | $455,096 | $135,045 | $320,051 |
| 2023 | $25,063 | $420,840 | $124,880 | $295,960 |
| 2022 | $23,744 | $397,570 | $120,050 | $277,520 |
| 2021 | $23,168 | $387,680 | $117,060 | $270,620 |
| 2020 | $22,282 | $379,180 | $114,490 | $264,690 |
| 2019 | $21,836 | $360,500 | $108,850 | $251,650 |
| 2018 | $22,542 | $369,860 | $103,050 | $266,810 |
| 2017 | $22,074 | $352,450 | $98,200 | $254,250 |
| 2016 | $21,642 | $332,030 | $92,510 | $239,520 |
| 2015 | $21,468 | $309,320 | $86,180 | $223,140 |
| 2014 | $23,478 | $310,660 | $69,740 | $240,920 |
| 2013 | $23,214 | $315,040 | $70,720 | $244,320 |
Source: Public Records
Map
Nearby Homes
- 211 N Hwy N
- 500 S Kenilworth Ave
- 15 Manchester Ln
- 219 E Saint Charles Rd
- 224 E May St
- 28 Windsor Dr
- 570 S Parkside Ave
- 580 S Kearsage Ave
- 611 S Prospect Ave
- 333 E Huntington Ln
- 349 E Parkview Ave
- 562 S Poplar Ave
- 613 S Chatham Ave
- 618 S Swain Ave
- 153 S Kenmore Ave
- 145 S York St Unit 404
- 145 S York St Unit 322
- 694 S York St
- 274 E Crescent Ave
- 680 S Bryan St
- 413 S York St
- 429 S York St
- 433 S York St
- 410 S Kenilworth Ave
- 405 S York St
- 404 S Kenilworth Ave
- 416 S York St
- 416 S York St Unit 420A
- 420 S York St
- 412 S York St
- 428 S Kenilworth Ave
- 424 S York St
- 400 S Kenilworth Ave
- 443 S York St
- 428 S York St
- 397 S York St
- 432 S Kenilworth Ave
- 432 S York St
- 400 S York St
- 394 S Kenilworth Ave