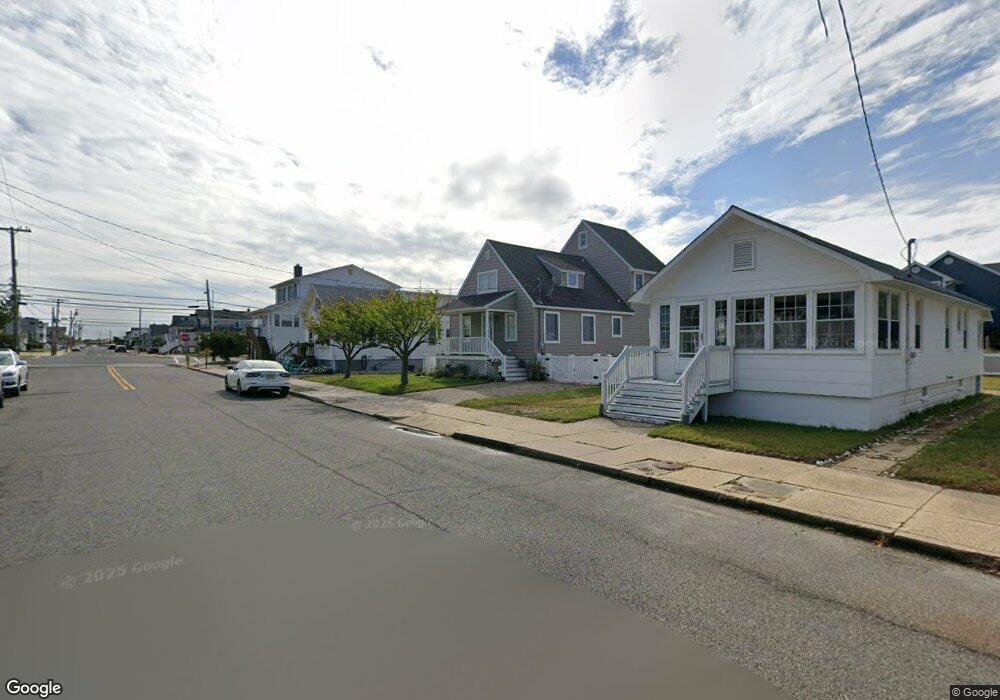
109 E St Seaside Park, NJ 08752
Estimated Value: $860,423 - $1,236,000
4
Beds
1
Bath
1,608
Sq Ft
$612/Sq Ft
Est. Value
About This Home
This home is located at 109 E St, Seaside Park, NJ 08752 and is currently estimated at $983,356, approximately $611 per square foot. 109 E St is a home located in Ocean County with nearby schools including Central Regional Middle School and Central Regional High School.
Ownership History
Date
Name
Owned For
Owner Type
Purchase Details
Closed on
Jun 18, 2021
Sold by
Quigley Daniel J and Quigley Magdalene A
Bought by
Degan Genna and Shapella Anthony
Current Estimated Value
Home Financials for this Owner
Home Financials are based on the most recent Mortgage that was taken out on this home.
Original Mortgage
$285,000
Outstanding Balance
$258,032
Interest Rate
2.9%
Mortgage Type
New Conventional
Estimated Equity
$725,324
Purchase Details
Closed on
Jul 14, 2006
Sold by
Jeanette M Tilles Revocable Trust and Tilles Mindy
Bought by
Saje Llc
Purchase Details
Closed on
Apr 29, 2004
Sold by
Quigley Joseph N and Quigley Jeanie
Bought by
Quigley Daniel J and Quigley Magdalene A
Create a Home Valuation Report for This Property
The Home Valuation Report is an in-depth analysis detailing your home's value as well as a comparison with similar homes in the area
Home Values in the Area
Average Home Value in this Area
Purchase History
| Date | Buyer | Sale Price | Title Company |
|---|---|---|---|
| Degan Genna | $585,000 | Attorney Title Services Llc | |
| Saje Llc | -- | None Available | |
| Quigley Daniel J | -- | -- |
Source: Public Records
Mortgage History
| Date | Status | Borrower | Loan Amount |
|---|---|---|---|
| Open | Degan Genna | $285,000 |
Source: Public Records
Tax History
| Year | Tax Paid | Tax Assessment Tax Assessment Total Assessment is a certain percentage of the fair market value that is determined by local assessors to be the total taxable value of land and additions on the property. | Land | Improvement |
|---|---|---|---|---|
| 2025 | $8,659 | $529,300 | $400,000 | $129,300 |
| 2024 | $8,516 | $529,300 | $400,000 | $129,300 |
Source: Public Records
Map
Nearby Homes
Your Personal Tour Guide
Ask me questions while you tour the home.