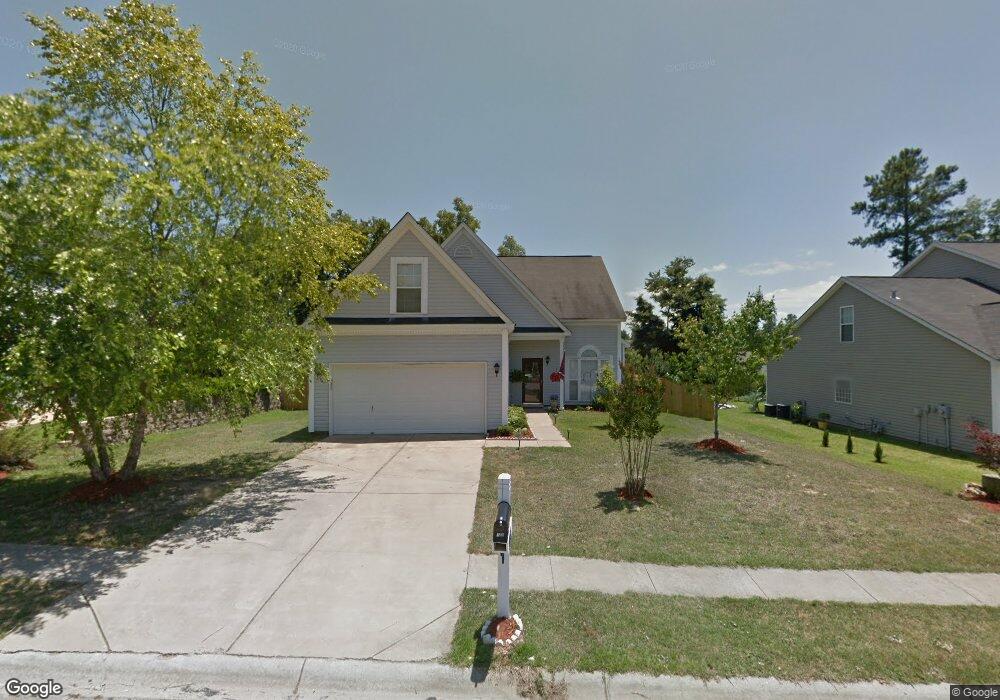
109 Eagle Pointe Dr Chapin, SC 29036
Estimated Value: $270,354 - $304,000
4
Beds
3
Baths
2,017
Sq Ft
$141/Sq Ft
Est. Value
About This Home
This home is located at 109 Eagle Pointe Dr, Chapin, SC 29036 and is currently estimated at $285,089, approximately $141 per square foot. 109 Eagle Pointe Dr is a home located in Lexington County with nearby schools including Chapin Elementary School, Chapin Intermediate, and Chapin High School.
Ownership History
Date
Name
Owned For
Owner Type
Purchase Details
Closed on
Jun 26, 2020
Sold by
Smith Adam C
Bought by
Mecollam David Stanley and Mecollam Karina Forbes
Current Estimated Value
Home Financials for this Owner
Home Financials are based on the most recent Mortgage that was taken out on this home.
Original Mortgage
$177,721
Outstanding Balance
$157,884
Interest Rate
3.2%
Mortgage Type
FHA
Estimated Equity
$127,205
Purchase Details
Closed on
Jul 26, 2016
Sold by
Smith Jennifer N
Bought by
Smith Adam C
Purchase Details
Closed on
Aug 19, 2011
Sold by
Caldwell David T and Caldwell Stephanie R
Bought by
Smith Adam C and Smith Jennifer N
Home Financials for this Owner
Home Financials are based on the most recent Mortgage that was taken out on this home.
Original Mortgage
$135,476
Interest Rate
4.25%
Mortgage Type
FHA
Purchase Details
Closed on
Jun 28, 2002
Sold by
Beazer Homes Corp
Bought by
Caldwell David T
Create a Home Valuation Report for This Property
The Home Valuation Report is an in-depth analysis detailing your home's value as well as a comparison with similar homes in the area
Home Values in the Area
Average Home Value in this Area
Purchase History
| Date | Buyer | Sale Price | Title Company |
|---|---|---|---|
| Mecollam David Stanley | $181,000 | None Available | |
| Smith Adam C | -- | None Available | |
| Smith Adam C | $139,000 | -- | |
| Caldwell David T | $150,500 | -- |
Source: Public Records
Mortgage History
| Date | Status | Borrower | Loan Amount |
|---|---|---|---|
| Open | Mecollam David Stanley | $177,721 | |
| Previous Owner | Smith Adam C | $135,476 |
Source: Public Records
Tax History
| Year | Tax Paid | Tax Assessment Tax Assessment Total Assessment is a certain percentage of the fair market value that is determined by local assessors to be the total taxable value of land and additions on the property. | Land | Improvement |
|---|---|---|---|---|
| 2024 | $1,193 | $7,240 | $1,000 | $6,240 |
| 2023 | $1,108 | $7,240 | $1,000 | $6,240 |
| 2022 | $1,118 | $7,240 | $1,000 | $6,240 |
| 2020 | $1,001 | $6,193 | $1,000 | $5,193 |
| 2019 | $944 | $5,743 | $1,000 | $4,743 |
| 2018 | $831 | $5,743 | $1,000 | $4,743 |
| 2017 | $809 | $5,743 | $1,000 | $4,743 |
| 2016 | $830 | $5,743 | $1,000 | $4,743 |
| 2015 | $822 | $5,743 | $1,000 | $4,743 |
| 2014 | $801 | $5,559 | $1,000 | $4,559 |
| 2013 | -- | $5,560 | $1,000 | $4,560 |
Source: Public Records
Map
Nearby Homes
- 392 Eagle Pointe Dr
- 814 Dutchmaster Dr
- 160 State Road S-32-716
- 147 State Road S-32-716
- 368 Frick Ct
- 153 Rushton Dr
- 1533 Saugus Ct
- 312 Throne Ct
- 192 Palm St
- 720 Topline St
- 1661 Old Lexington Hwy
- 134 Walkbridge Way
- 366 Gallery Cliff Dr
- 512 Old Bush River Rd
- 228 Bickley View Ct
- 339 Newberg Rd
- 271 Bickley View Ct
- 171 Elm Creek Dr
- 0 Dreher Island Rd Unit 21647709
- 0 Dreher Island Rd Unit 587193
- 113 Eagle Pointe Dr
- 105 Eagle Pointe Dr
- 105 105 Eagle Pointe Dr
- 129 Wingspan Way
- 125 Wingspan Way
- 117 Eagle Pointe Dr
- 101 Eagle Pointe Dr
- 133 Wingspan Way
- 121 Wingspan Way
- 108 Eagle Pointe Dr
- 104 Eagle Pointe Dr
- 112 Eagle Pointe Dr
- 137 Wingspan Way
- 117 Wingspan Way Unit EAGLE POINTE Chapin
- 117 Wingspan Way
- 121 Eagle Pointe Dr
- 399 Eagle Pointe Dr
- 100 Eagle Pointe Dr
- 116 Eagle Pointe Dr
- 141 Wingspan Way
Your Personal Tour Guide
Ask me questions while you tour the home.