Estimated Value: $304,000 - $337,670
About This Home
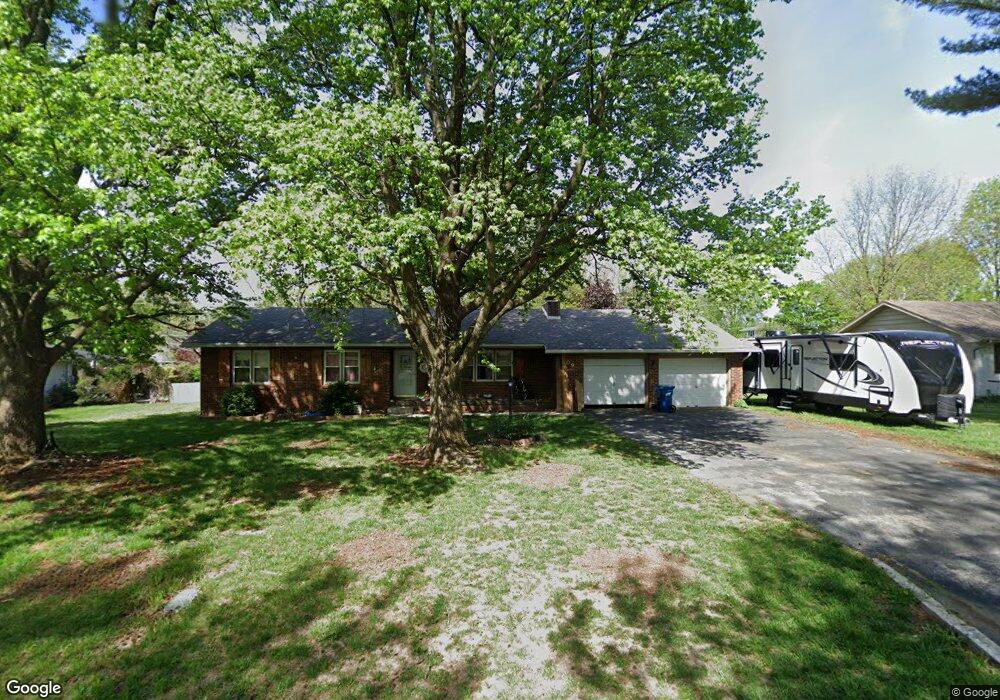
This home is located at 109 Estes St, Nixa, MO 65714 and is currently estimated at $320,668, approximately $110 per square foot. 109 Estes St is a home located in Christian County with nearby schools including Espy Elementary School, Nixa Junior High School, and Nicholas A. Inman Intermediate School.
Ownership History
We collect this data history from publicly available records. To have your information removed, we recommend requesting removal directly through your county’s website.
Purchase Details
Home Financials for this Owner
Home Financials are based on the most recent Mortgage that was taken out on this home.Purchase Details
Purchase Details
Purchase Details
Home Financials for this Owner
Home Financials are based on the most recent Mortgage that was taken out on this home.Home Values in the Area
Average Home Value in this Area
Purchase History
We collect this data history from publicly available records. To have your information removed, we recommend requesting removal directly through your county’s website.
| Date | Buyer | Sale Price | Title Company |
|---|---|---|---|
| $253,900 | Meridian Title | ||
| $253,900 | Meridian Title | ||
| -- | None Listed On Document | ||
| -- | Lincoln Land Title | ||
| -- | Lincoln Land Title Inc | ||
| -- | None Available |
Mortgage History
We collect this data history from publicly available records. To have your information removed, we recommend requesting removal directly through your county’s website.
| Date | Status | Borrower | Loan Amount |
|---|---|---|---|
| Open | $150,000 | ||
| Closed | $150,000 | ||
| Previous Owner | $76,000 |
Tax History
We collect this data history from publicly available records. To have your information removed, we recommend requesting removal directly through your county’s website.
| Year | Tax Paid | Tax Assessment Tax Assessment Total Assessment is a certain percentage of the fair market value that is determined by local assessors to be the total taxable value of land and additions on the property. | Land | Improvement |
|---|---|---|---|---|
| 2025 | $1,796 | $30,690 | -- | -- |
| 2024 | $1,796 | $28,820 | -- | -- |
| 2023 | $1,796 | $28,820 | -- | -- |
| 2022 | $1,739 | $27,870 | $0 | $0 |
| 2021 | $1,740 | $27,870 | $0 | $0 |
| 2020 | $1,618 | $24,740 | $0 | $0 |
| 2019 | $1,618 | $24,740 | $0 | $0 |
| 2018 | $1,507 | $24,740 | $0 | $0 |
| 2017 | $1,507 | $24,740 | $0 | $0 |
| 2016 | $1,235 | $20,580 | $0 | $0 |
| 2015 | $1,236 | $20,580 | $20,580 | $0 |
| 2014 | $1,202 | $20,500 | $0 | $0 |
| 2013 | $12 | $20,500 | $0 | $0 |
| 2011 | $12 | $39,720 | $0 | $0 |
Map
- 203 N Ellen St
- 715 W Wasson St
- 714 W Wasson Dr
- 000 (Tbd) Highway 160 (14 8 Acres) St
- 000 West St
- 805 W Briarwood Ln
- 204 N Big Horn Rd
- 1121 E Plum Creek Rd
- 402 N Big Horn Rd
- 405 N Big Horn Rd
- 1145 E Manitou Ct
- Tbd U S 160
- Sw Corner Highway 160 & St S
- 607 N Persimmon Dr
- 1334 W Mount Vernon St
- 915 Wesley Rd
- 704 W Savanna Ct
- 310 Great Plains St
- 207 Meadow St
- 301 N Meadow St
- 109 N Estes St
- 201 Estes St
- 107 N Estes St
- 200 Estes St
- 108 N Ellen St
- 108 N Estes St
- 106 N Estes St
- 203 N Estes St
- 200 N Ellen St
- 105 Estes St
- 202 N Estes St
- 202 N Ellen St
- 104 N Estes St
- 104 N Ellen St
- 205 Estes St
- 204 N Ellen St
- 109 N Ellen St
- 201 N Ellen St
- 107 N Ellen St
- 201 N Old Wilderness Rd
Ask me questions while you tour the home.