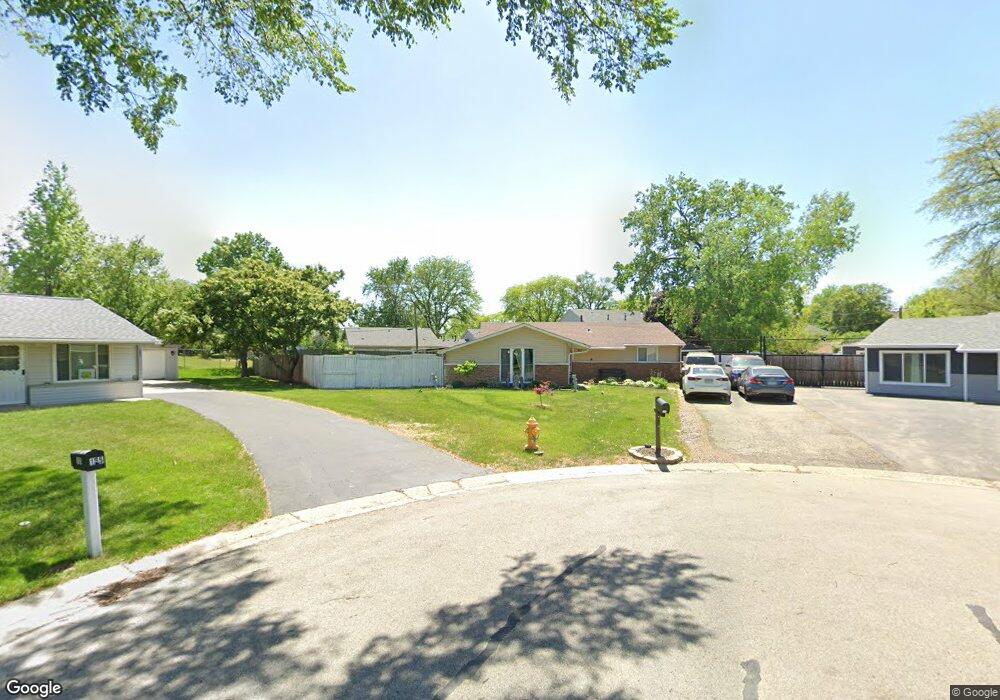
109 Fairwood Ct Bolingbrook, IL 60440
East Bolingbrook NeighborhoodEstimated Value: $226,000 - $330,000
4
Beds
2
Baths
990
Sq Ft
$293/Sq Ft
Est. Value
About This Home
This home is located at 109 Fairwood Ct, Bolingbrook, IL 60440 and is currently estimated at $289,888, approximately $292 per square foot. 109 Fairwood Ct is a home located in Will County with nearby schools including Bernard J Ward Elementary School, Brooks Middle School, and Hubert H Humphrey Middle School.
Ownership History
Date
Name
Owned For
Owner Type
Purchase Details
Closed on
Oct 11, 2011
Sold by
Deutsche Bank National Trust Company
Bought by
Nolasco Erik
Current Estimated Value
Purchase Details
Closed on
Jun 14, 2010
Sold by
Simental Elias and Case #09 Ch 335
Bought by
Deutsche Bank National Trust Company
Purchase Details
Closed on
Dec 16, 2009
Sold by
Simental Elias
Bought by
Deutsche Bank National Trust Company
Purchase Details
Closed on
Oct 2, 2006
Sold by
Mrozek James and Mrozek Christine
Bought by
Simental Elias
Home Financials for this Owner
Home Financials are based on the most recent Mortgage that was taken out on this home.
Original Mortgage
$150,000
Interest Rate
9.6%
Mortgage Type
Purchase Money Mortgage
Purchase Details
Closed on
Jun 18, 1998
Sold by
Ocwen Federal Bank Fsb
Bought by
Mcneely Linda
Create a Home Valuation Report for This Property
The Home Valuation Report is an in-depth analysis detailing your home's value as well as a comparison with similar homes in the area
Home Values in the Area
Average Home Value in this Area
Purchase History
| Date | Buyer | Sale Price | Title Company |
|---|---|---|---|
| Nolasco Erik | $55,000 | None Available | |
| Deutsche Bank National Trust Company | -- | None Available | |
| Deutsche Bank National Trust Company | $140,000 | None Available | |
| Simental Elias | $190,000 | Chicago Title Insurance Co | |
| Mcneely Linda | $65,000 | -- |
Source: Public Records
Mortgage History
| Date | Status | Borrower | Loan Amount |
|---|---|---|---|
| Previous Owner | Simental Elias | $150,000 |
Source: Public Records
Tax History Compared to Growth
Tax History
| Year | Tax Paid | Tax Assessment Tax Assessment Total Assessment is a certain percentage of the fair market value that is determined by local assessors to be the total taxable value of land and additions on the property. | Land | Improvement |
|---|---|---|---|---|
| 2024 | $7,303 | $87,075 | $19,391 | $67,684 |
| 2023 | $7,303 | $78,347 | $17,447 | $60,900 |
| 2022 | $6,389 | $70,633 | $15,729 | $54,904 |
| 2021 | $6,045 | $66,043 | $14,707 | $51,336 |
| 2020 | $5,854 | $63,871 | $14,223 | $49,648 |
| 2019 | $5,534 | $59,637 | $13,280 | $46,357 |
| 2018 | $5,075 | $54,864 | $12,218 | $42,646 |
| 2017 | $4,822 | $52,004 | $11,581 | $40,423 |
| 2016 | $4,467 | $47,600 | $10,600 | $37,000 |
| 2015 | $4,029 | $45,700 | $10,200 | $35,500 |
| 2014 | $4,029 | $42,300 | $9,400 | $32,900 |
| 2013 | $4,029 | $49,700 | $11,000 | $38,700 |
Source: Public Records
Map
Nearby Homes
- 184 Fairwood Dr
- 43 Fernwood Dr Unit D
- 372 Windsong Ct Unit 4110
- 321 Candlelight Ct Unit 111
- 2V Fernwood Dr
- 14 Fernwood Dr Unit B
- 10 Fernwood Dr Unit L
- 6 Fernwood Dr Unit 6
- 6 Fernwood Dr Unit G
- 5 Fernwood Dr
- 15B Fernwood Dr
- 124 Delmar Dr
- 124 W Briarcliff Rd
- 412 Greentree Ln Unit 6
- 141 N Lancaster Dr
- 430 Mallview Ln
- 443 Mallview Ln Unit 6
- 474 Mallview Ln
- 465 Bloomfield Dr Unit 1
- 210 Mill Stream Dr
- 108 Fairwood Ct
- 8N Fernwood Dr Unit 8N
- 5N Fernwood Dr
- 5N Fernwood Dr Unit 5N
- 11N Fernwood Dr
- 105 Fairwood Ct
- 10N Fernwood Dr
- 224 Harwood Dr
- 220 Harwood Dr
- 3N Fernwood Dr
- 13N Fernwood Dr
- 4N Fernwood Dr
- 14N Fernwood Dr Unit 14N
- 8L Fernwood Dr
- 7l Fernwood Dr
- 101 Fairwood Ct
- 104 Fairwood Ct
- 216 Harwood Dr
- 1N Fernwood Dr Unit 1N
- 2N Fernwood Dr Unit 2N