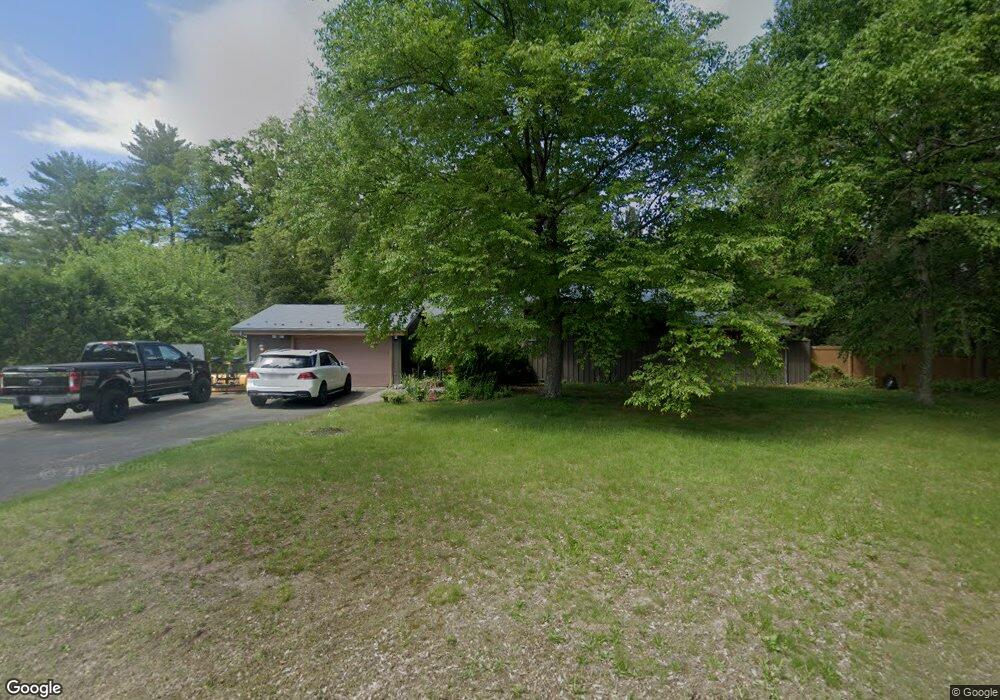
109 Falley Dr Westfield, MA 01085
Estimated Value: $409,000 - $449,683
3
Beds
2
Baths
1,628
Sq Ft
$266/Sq Ft
Est. Value
About This Home
This home is located at 109 Falley Dr, Westfield, MA 01085 and is currently estimated at $432,921, approximately $265 per square foot. 109 Falley Dr is a home located in Hampden County with nearby schools including Westfield High School and Saint Mary High School.
Ownership History
Date
Name
Owned For
Owner Type
Purchase Details
Closed on
Mar 6, 2006
Sold by
Wheeler David K and Wheeler Jacquelyn A
Bought by
Gibbs Joy J and Gibbs Michael J
Current Estimated Value
Home Financials for this Owner
Home Financials are based on the most recent Mortgage that was taken out on this home.
Original Mortgage
$224,000
Outstanding Balance
$126,521
Interest Rate
6.16%
Mortgage Type
Purchase Money Mortgage
Estimated Equity
$306,400
Purchase Details
Closed on
Dec 3, 1991
Sold by
Springfield Ins Sav
Bought by
Wheeler David K and Wheeler Jacqueline
Purchase Details
Closed on
Jun 25, 1991
Sold by
Morris G Bonnie
Bought by
Springfield Inst Svgs
Purchase Details
Closed on
Oct 4, 1989
Sold by
Guglielmo Frank A
Bought by
Morris G Bonnie
Create a Home Valuation Report for This Property
The Home Valuation Report is an in-depth analysis detailing your home's value as well as a comparison with similar homes in the area
Home Values in the Area
Average Home Value in this Area
Purchase History
| Date | Buyer | Sale Price | Title Company |
|---|---|---|---|
| Gibbs Joy J | $280,000 | -- | |
| Wheeler David K | $124,500 | -- | |
| Springfield Inst Svgs | $149,000 | -- | |
| Morris G Bonnie | $180,000 | -- |
Source: Public Records
Mortgage History
| Date | Status | Borrower | Loan Amount |
|---|---|---|---|
| Open | Gibbs Joy J | $224,000 | |
| Closed | Gibbs Joy J | $56,000 | |
| Previous Owner | Morris G Bonnie | $120,000 | |
| Previous Owner | Morris G Bonnie | $98,000 |
Source: Public Records
Tax History Compared to Growth
Tax History
| Year | Tax Paid | Tax Assessment Tax Assessment Total Assessment is a certain percentage of the fair market value that is determined by local assessors to be the total taxable value of land and additions on the property. | Land | Improvement |
|---|---|---|---|---|
| 2025 | $5,620 | $370,200 | $145,600 | $224,600 |
| 2024 | $5,709 | $357,500 | $132,900 | $224,600 |
| 2023 | $5,529 | $325,600 | $126,100 | $199,500 |
| 2022 | $5,371 | $290,500 | $112,700 | $177,800 |
| 2021 | $3,673 | $275,900 | $105,900 | $170,000 |
| 2020 | $3,478 | $264,300 | $105,900 | $158,400 |
| 2019 | $4,988 | $253,600 | $101,000 | $152,600 |
| 2018 | $4,910 | $253,600 | $101,000 | $152,600 |
| 2017 | $4,843 | $249,400 | $102,600 | $146,800 |
| 2016 | $4,848 | $249,400 | $102,600 | $146,800 |
| 2015 | $4,624 | $249,400 | $102,600 | $146,800 |
| 2014 | $3,459 | $249,400 | $102,600 | $146,800 |
Source: Public Records
Map
Nearby Homes
- 57 Falley Dr
- 16 Locust St
- 76 Shaker Rd
- 161 Wildflower Cir
- 901 Shaker Rd
- 1037 Shaker Rd
- 0 Feeding Hills Rd
- 103 Feeding Hills Rd
- 17 Jeanne Marie Dr
- 189 Springfield Rd Unit 23
- 0 E Mountain Rd
- 719 N West St
- 30 Cross St
- 20 Great Brook Dr
- 16 Yale St
- 323 Southwick Rd
- 25 White St
- 242 Eastwood Dr
- 120 Woodcliff Dr
- 8 N Longyard Rd