Estimated Value: $1,174,000 - $1,800,000
6
Beds
3
Baths
2,629
Sq Ft
$576/Sq Ft
Est. Value
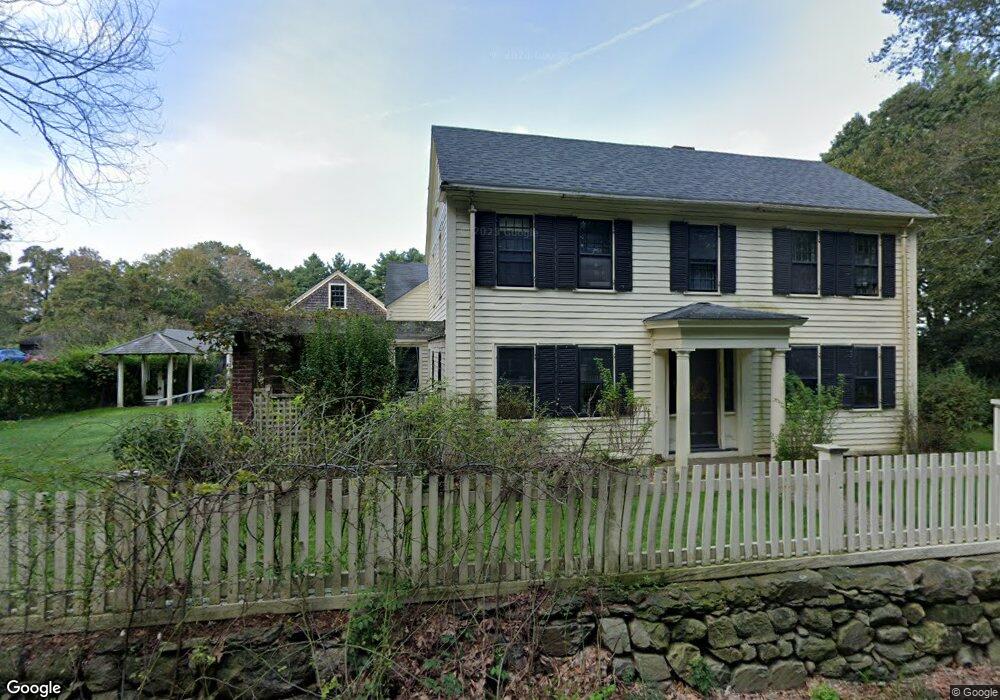
About This Home
This home is located at 109 Farm St, Dover, MA 02030 and is currently estimated at $1,514,700, approximately $576 per square foot. 109 Farm St is a home located in Norfolk County with nearby schools including Chickering Elementary School, Dover-Sherborn Regional Middle School, and Dover-Sherborn Regional High School.
Ownership History
Date
Name
Owned For
Owner Type
Purchase Details
Closed on
Oct 26, 2020
Sold by
Reitmayer Anne and Reitmayer Erica
Bought by
Reitmayer Anne and Eels Richard C
Current Estimated Value
Home Financials for this Owner
Home Financials are based on the most recent Mortgage that was taken out on this home.
Original Mortgage
$270,000
Outstanding Balance
$240,262
Interest Rate
2.8%
Mortgage Type
New Conventional
Estimated Equity
$1,274,438
Purchase Details
Closed on
Jun 8, 2016
Sold by
Kennedy Ft
Bought by
Reitmayer Anne and Reitmayer Erica
Home Financials for this Owner
Home Financials are based on the most recent Mortgage that was taken out on this home.
Original Mortgage
$200,000
Interest Rate
3.66%
Mortgage Type
Closed End Mortgage
Purchase Details
Closed on
Nov 16, 2012
Sold by
Kennedy Anne R
Bought by
Kennedy Ft and Reitmayer Anne
Create a Home Valuation Report for This Property
The Home Valuation Report is an in-depth analysis detailing your home's value as well as a comparison with similar homes in the area
Home Values in the Area
Average Home Value in this Area
Purchase History
| Date | Buyer | Sale Price | Title Company |
|---|---|---|---|
| Reitmayer Anne | $600,000 | None Available | |
| Reitmayer Anne | -- | -- | |
| Kennedy Ft | -- | -- |
Source: Public Records
Mortgage History
| Date | Status | Borrower | Loan Amount |
|---|---|---|---|
| Open | Reitmayer Anne | $270,000 | |
| Previous Owner | Reitmayer Anne | $200,000 |
Source: Public Records
Tax History
| Year | Tax Paid | Tax Assessment Tax Assessment Total Assessment is a certain percentage of the fair market value that is determined by local assessors to be the total taxable value of land and additions on the property. | Land | Improvement |
|---|---|---|---|---|
| 2025 | $14,304 | $1,269,200 | $887,000 | $382,200 |
| 2024 | $13,625 | $1,243,200 | $887,000 | $356,200 |
| 2023 | $13,188 | $1,081,900 | $771,800 | $310,100 |
| 2022 | $12,803 | $1,030,800 | $759,600 | $271,200 |
| 2021 | $12,624 | $979,400 | $759,600 | $219,800 |
| 2020 | $12,575 | $979,400 | $759,600 | $219,800 |
| 2019 | $12,664 | $979,400 | $759,600 | $219,800 |
| 2018 | $11,448 | $891,600 | $686,100 | $205,500 |
| 2017 | $10,864 | $832,500 | $627,300 | $205,200 |
| 2016 | $10,849 | $842,300 | $637,100 | $205,200 |
| 2015 | $11,972 | $942,700 | $737,500 | $205,200 |
Source: Public Records
Map
Nearby Homes
- 114 Farm St
- 103 Farm St
- 8 Greystone Rd
- 44 Glen St
- 8 Woodfall Rd
- 61 Glen St
- 36 Yorkshire Rd
- 25 Longmeadow Rd
- 157 Centre St
- 345 North St
- 137 Lake St
- 14 Sunset Way Unit 14
- 57 Colonial Rd
- 63 Farm Road Lot 5
- 32 Cider Hill Ln
- 14 Sewall Brook Ln
- 174 S Main St
- 303 Eliot St
- 11 Wyndemere Ln
- 2 Phillips Pond Rd
Your Personal Tour Guide
Ask me questions while you tour the home.