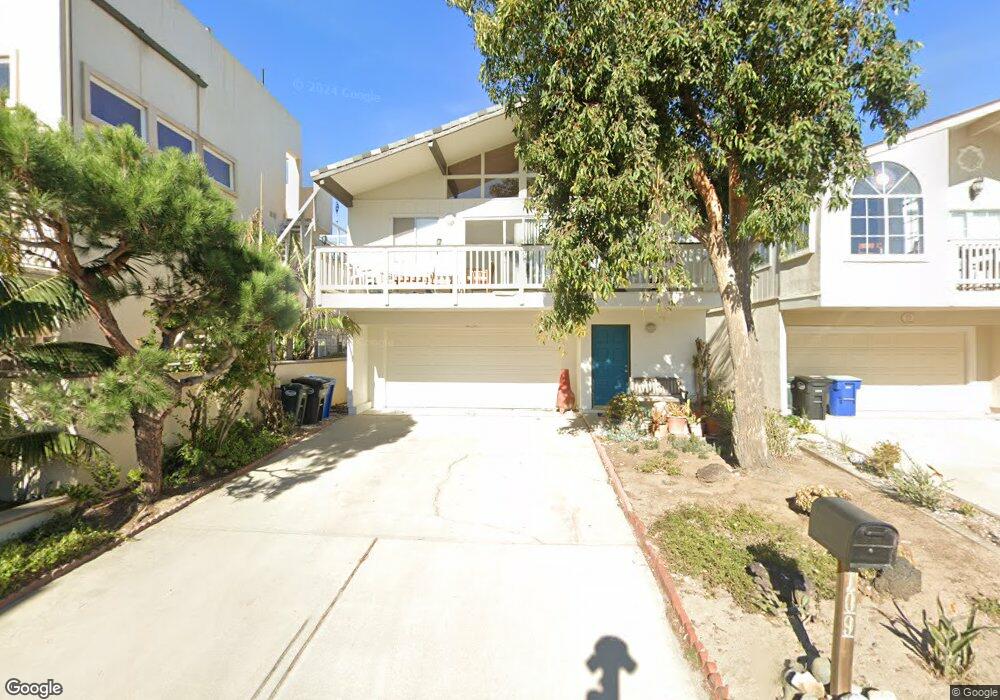
109 Fillmore Ave Oxnard, CA 93035
Silver Strand NeighborhoodEstimated Value: $1,009,854 - $1,263,000
About This Home
This home is located at 109 Fillmore Ave, Oxnard, CA 93035 and is currently estimated at $1,140,464, approximately $879 per square foot. 109 Fillmore Ave is a home located in Ventura County with nearby schools including Hollywood Beach Elementary School, Oxnard High School, and St. Anthony's Elementary School.
Ownership History
We collect this data history from publicly available records. To have your information removed, we recommend requesting removal directly through your county’s website.
Purchase Details
Purchase Details
Home Financials for this Owner
Home Financials are based on the most recent Mortgage that was taken out on this home.Purchase Details
Home Values in the Area
Average Home Value in this Area
Purchase History
We collect this data history from publicly available records. To have your information removed, we recommend requesting removal directly through your county’s website.
| Date | Buyer | Sale Price | Title Company |
|---|---|---|---|
| -- | None Available | ||
| -- | None Available | ||
| $525,000 | Fidelity National Title Co | ||
| -- | -- |
Mortgage History
We collect this data history from publicly available records. To have your information removed, we recommend requesting removal directly through your county’s website.
| Date | Status | Borrower | Loan Amount |
|---|---|---|---|
| Open | $460,000 |
Tax History
We collect this data history from publicly available records. To have your information removed, we recommend requesting removal directly through your county’s website.
| Year | Tax Paid | Tax Assessment Tax Assessment Total Assessment is a certain percentage of the fair market value that is determined by local assessors to be the total taxable value of land and additions on the property. | Land | Improvement |
|---|---|---|---|---|
| 2025 | $7,509 | $646,487 | $535,667 | $110,820 |
| 2024 | $7,509 | $633,811 | $525,163 | $108,648 |
| 2023 | $7,133 | $621,384 | $514,866 | $106,518 |
| 2022 | $6,930 | $609,200 | $504,770 | $104,430 |
| 2021 | $6,926 | $597,255 | $494,872 | $102,383 |
| 2020 | $6,842 | $591,133 | $489,799 | $101,334 |
| 2019 | $6,745 | $579,544 | $480,196 | $99,348 |
| 2018 | $6,518 | $568,181 | $470,781 | $97,400 |
| 2017 | $6,276 | $557,041 | $461,550 | $95,491 |
| 2016 | $6,086 | $546,119 | $452,500 | $93,619 |
| 2015 | $5,933 | $537,918 | $445,704 | $92,214 |
| 2014 | $5,870 | $527,382 | $436,974 | $90,408 |
Map
- 133 Santa Paula Ave
- 126 Malibu Ave
- 261 Highland Dr
- 152 Highland Dr
- 2301 Chico Ct
- 105 Malibu Ave
- 2425 Panama Dr
- 360 Melrose Dr
- 2408 Ocean Dr
- 2421 Ocean Dr
- 317 Melrose Dr
- 253 Melrose Dr
- 2525 Roosevelt Blvd
- 316 Santa Monica Dr
- 145 Los Angeles Ave
- 148 Los Angeles Ave
- 137 Santa Monica Ave
- 264 Hollywood Blvd
- 274 Sunset
- 3009 Ocean Dr
- 1408 Ocean Dr
- 1416 Ocean Dr
- 1400 Ocean Dr
- 1424 Ocean Dr
- 108 Moorpark Ave
- 113 Fillmore Ave
- 112 Moorpark Ave
- 1324 Ocean Dr
- 117 Fillmore Ave
- 116 Moorpark Ave
- 1500 Ocean Dr
- 1316 Ocean Dr
- 1413 Ocean Dr
- 112 Fillmore Ave
- 121 Fillmore Ave
- 1417 Ocean Dr
- 1401 Ocean Dr Unit B
- 1401 Ocean Dr
- 120 Moorpark Ave
- 109 Moorpark Ave
Ask me questions while you tour the home.