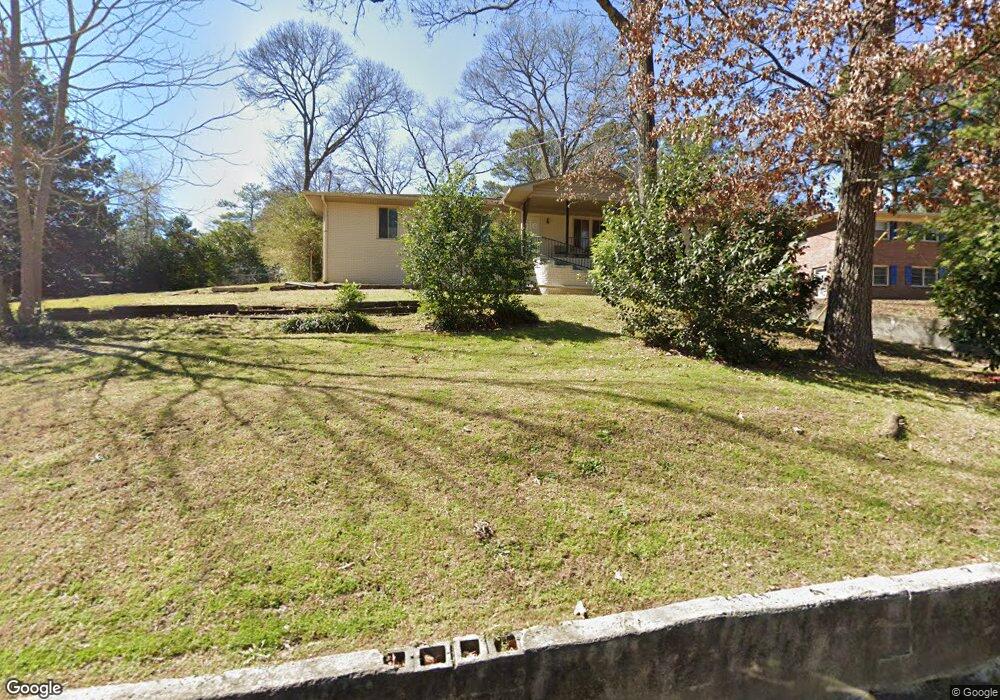
109 Flournoy Dr Warner Robins, GA 31093
Estimated Value: $163,000 - $218,000
4
Beds
2
Baths
1,798
Sq Ft
$108/Sq Ft
Est. Value
About This Home
This home is located at 109 Flournoy Dr, Warner Robins, GA 31093 and is currently estimated at $193,362, approximately $107 per square foot. 109 Flournoy Dr is a home located in Houston County with nearby schools including Westside Elementary School, Northside Middle School, and Northside High School.
Ownership History
Date
Name
Owned For
Owner Type
Purchase Details
Closed on
Nov 6, 2023
Sold by
Taylor Craig A
Bought by
Taylor Jake
Current Estimated Value
Purchase Details
Closed on
Oct 23, 2007
Sold by
Keltz Lavene A and Clanton Volney Diane
Bought by
Taylor James A
Purchase Details
Closed on
May 7, 1999
Sold by
Mcgregor Udo K
Bought by
Clanton V Diane
Purchase Details
Closed on
Feb 17, 1997
Sold by
Mahotiere Sauveur
Bought by
Mcgregor Udo K
Purchase Details
Closed on
May 7, 1987
Sold by
Mahotiere Marlene
Bought by
Mahotiere Sauveur
Purchase Details
Closed on
Dec 21, 1977
Sold by
Stammer Karl H and Stammer Grace T
Bought by
Mahotiere Sauveur and Mahotiere Marlene
Purchase Details
Closed on
Jan 1, 1968
Sold by
Stammer Karl H
Bought by
Stammer Karl H and Stammer Grace T
Purchase Details
Closed on
Sep 16, 1967
Sold by
Pike David F
Bought by
Stammer Karl H
Purchase Details
Closed on
Nov 16, 1954
Bought by
Pike David F
Create a Home Valuation Report for This Property
The Home Valuation Report is an in-depth analysis detailing your home's value as well as a comparison with similar homes in the area
Home Values in the Area
Average Home Value in this Area
Purchase History
| Date | Buyer | Sale Price | Title Company |
|---|---|---|---|
| Taylor Jake | -- | None Listed On Document | |
| Taylor Jake | -- | None Listed On Document | |
| Tacker Wendy Anne | -- | None Listed On Document | |
| Taylor James A | $55,000 | None Available | |
| Clanton V Diane | $107,000 | -- | |
| Mcgregor Udo K | $86,000 | -- | |
| Mahotiere Sauveur | -- | -- | |
| Mahotiere Sauveur | -- | -- | |
| Stammer Karl H | -- | -- | |
| Stammer Karl H | -- | -- | |
| Pike David F | -- | -- |
Source: Public Records
Tax History Compared to Growth
Tax History
| Year | Tax Paid | Tax Assessment Tax Assessment Total Assessment is a certain percentage of the fair market value that is determined by local assessors to be the total taxable value of land and additions on the property. | Land | Improvement |
|---|---|---|---|---|
| 2024 | $1,492 | $62,360 | $9,280 | $53,080 |
| 2023 | $1,279 | $52,920 | $9,280 | $43,640 |
| 2022 | $1,139 | $47,120 | $7,480 | $39,640 |
| 2021 | $1,035 | $42,600 | $7,480 | $35,120 |
| 2020 | $1,030 | $42,200 | $7,480 | $34,720 |
| 2019 | $1,030 | $42,200 | $7,480 | $34,720 |
| 2018 | $808 | $42,200 | $7,480 | $34,720 |
| 2017 | $809 | $42,200 | $7,480 | $34,720 |
| 2016 | $810 | $42,200 | $7,480 | $34,720 |
| 2015 | $810 | $42,200 | $7,480 | $34,720 |
| 2014 | -- | $42,200 | $7,480 | $34,720 |
| 2013 | -- | $43,120 | $7,480 | $35,640 |
Source: Public Records
Map
Nearby Homes
- 501 Pinecrest Dr
- 111 Hawthorne Rd
- 221 Gilchrist Dr
- 725 B East Side Dr
- 209 Knodishall Dr
- 303 Pinecrest Dr
- 110 Foxfire Dr
- 109 Fisher St
- 110 Westcliff Cir Unit C
- 123 Tanglewood Dr
- 857 Ola Dr
- 106 Westcliff Cir
- 103 Westcliff Cir Unit A
- 103 Westcliff Cir Unit A
- 115 Wray St
- 200 Ridgeland Dr
- 102 Westcliff Center St Unit D
- 86 Westcliff Cir
- 110 Westcliff Center St
- 316 Meadowridge Dr
- 107 Flournoy Dr
- 400 Knodishall Dr
- 402 Knodishall Dr
- 314 Knodishall Dr
- 110 Flournoy Dr
- 312 Knodishall Dr
- 404 Knodishall Dr
- 117 Flournoy Dr
- 100 Winship Dr
- 308 Knodishall Dr
- 406 Knodishall Dr
- 401 Knodishall Dr
- 205 Lumpkin Dr
- 207 Stanford St
- 119 Flournoy Dr
- 202 Lumpkin Dr
- 403 Knodishall Dr
- 408 Knodishall Dr
- 102 Winship Dr
- 101 Winship Dr