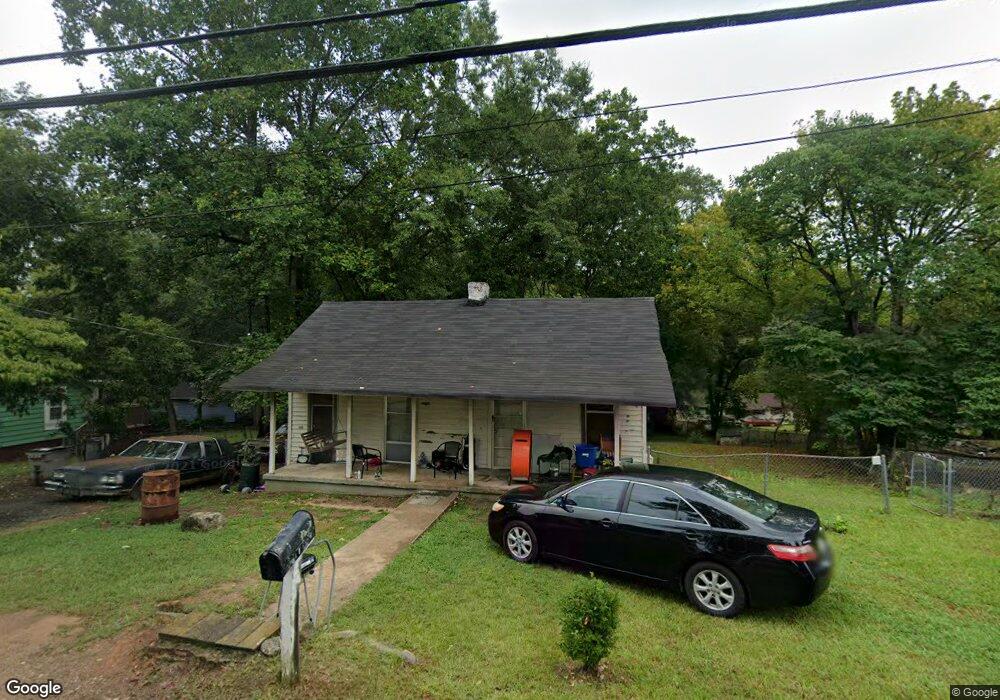
109 Grady St Lagrange, GA 30240
Estimated Value: $51,000 - $155,000
1
Bed
1
Bath
690
Sq Ft
$118/Sq Ft
Est. Value
About This Home
This home is located at 109 Grady St, Lagrange, GA 30240 and is currently estimated at $81,272, approximately $117 per square foot. 109 Grady St is a home located in Troup County with nearby schools including Ethel W. Kight Elementary School, Hollis Hand Elementary School, and Franklin Forest Elementary School.
Ownership History
Date
Name
Owned For
Owner Type
Purchase Details
Closed on
Sep 30, 1994
Sold by
Dora B Johnson
Bought by
Coleman Willie and Coleman Louneal D
Current Estimated Value
Purchase Details
Closed on
Jul 20, 1994
Sold by
Johnson Charlie
Bought by
Dora B Johnson
Purchase Details
Closed on
Dec 4, 1962
Sold by
Johnson Charlie B and Johnson Dora B
Bought by
Johnson Charlie
Purchase Details
Closed on
May 27, 1959
Sold by
Peavy E H
Bought by
Johnson Charlie B and Johnson Dora B
Create a Home Valuation Report for This Property
The Home Valuation Report is an in-depth analysis detailing your home's value as well as a comparison with similar homes in the area
Purchase History
| Date | Buyer | Sale Price | Title Company |
|---|---|---|---|
| Coleman Willie | $11,500 | -- | |
| Dora B Johnson | -- | -- | |
| Johnson Charlie | -- | -- | |
| Johnson Charlie B | -- | -- |
Source: Public Records
Tax History
| Year | Tax Paid | Tax Assessment Tax Assessment Total Assessment is a certain percentage of the fair market value that is determined by local assessors to be the total taxable value of land and additions on the property. | Land | Improvement |
|---|---|---|---|---|
| 2025 | $580 | $21,260 | $3,000 | $18,260 |
| 2024 | $508 | $18,620 | $3,000 | $15,620 |
| 2023 | $465 | $17,060 | $3,000 | $14,060 |
| 2022 | $453 | $16,220 | $3,000 | $13,220 |
| 2021 | $227 | $7,532 | $3,000 | $4,532 |
| 2020 | $227 | $7,532 | $3,000 | $4,532 |
| 2019 | $215 | $7,124 | $3,000 | $4,124 |
| 2018 | $215 | $7,124 | $3,000 | $4,124 |
| 2017 | $215 | $7,132 | $3,008 | $4,124 |
| 2016 | $210 | $6,966 | $3,008 | $3,958 |
| 2015 | $210 | $6,966 | $3,008 | $3,958 |
| 2014 | $203 | $6,701 | $3,008 | $3,693 |
| 2013 | -- | $6,920 | $3,008 | $3,912 |
Source: Public Records
Map
Nearby Homes
- 101 Crown St Unit LOT 5
- 205 Grady St
- 102 Crown St Unit LOT 1
- 149 Laurel Ridge Ave E
- 120 Laurel Ridge Ave E
- 134 Laurel Ridge Ave E
- 167 S Kight Dr
- 1518 Brownwood Ave
- 608 Wilburn Ave
- 610 Wilburn Ave
- 109 Garfield St
- 202 Parker Ln
- 107 Clark St
- 517 Jefferson St
- 1308 Forrest Ave
- 507 S Lee St
- 1304 Forrest Ave
- 1405 Forrest Ave
- 1402 Forrest Ave
- 211 Moores Hill
Your Personal Tour Guide
Ask me questions while you tour the home.