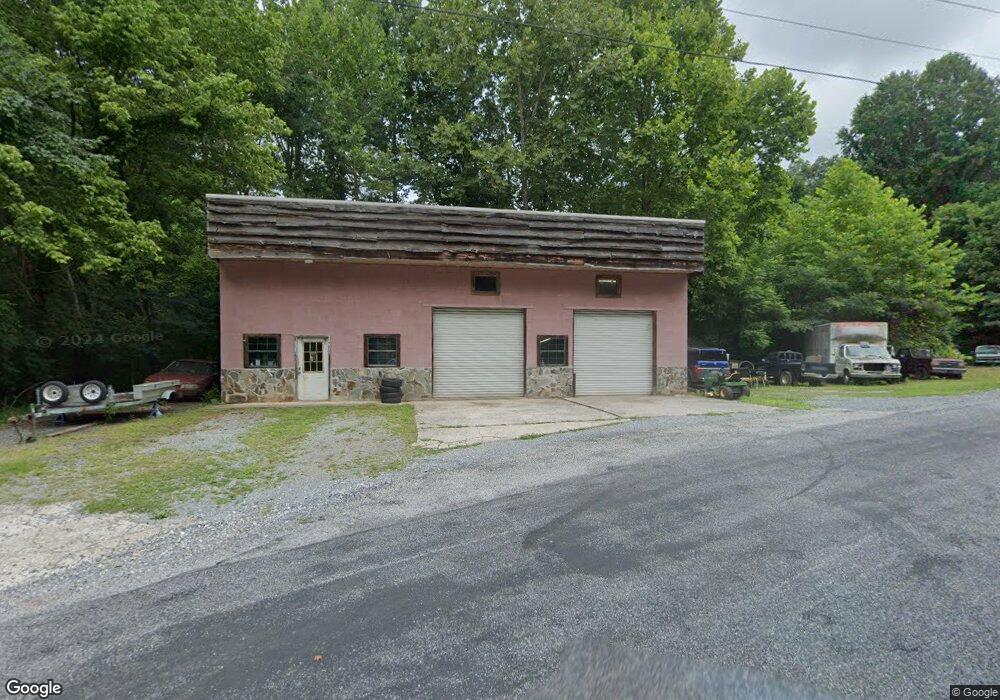
109 Harper Rd Ellijay, GA 30540
Estimated Value: $155,964
--
Bed
--
Bath
1,500
Sq Ft
$104/Sq Ft
Est. Value
About This Home
This home is located at 109 Harper Rd, Ellijay, GA 30540 and is currently estimated at $155,964, approximately $103 per square foot. 109 Harper Rd is a home located in Gilmer County with nearby schools including Ellijay Elementary School, Clear Creek Elementary School, and Clear Creek Middle School.
Ownership History
Date
Name
Owned For
Owner Type
Purchase Details
Closed on
Feb 22, 2018
Sold by
Wright Shay Kristin
Bought by
Smith Scott
Current Estimated Value
Purchase Details
Closed on
Oct 26, 2017
Sold by
Ball Bonnie
Bought by
Wright Shay Kristin
Home Financials for this Owner
Home Financials are based on the most recent Mortgage that was taken out on this home.
Original Mortgage
$52,000
Interest Rate
3.83%
Mortgage Type
Commercial
Purchase Details
Closed on
Oct 26, 2012
Sold by
Community & Southern Bank
Bought by
Ball Bonnie
Purchase Details
Closed on
Mar 6, 2012
Sold by
Dillard Phillip Les
Bought by
Community & Southern Bank
Purchase Details
Closed on
Jun 24, 2005
Sold by
Ball Bonnie Ruth
Bought by
Dillard Phillip Les and Dillard Charles Les
Purchase Details
Closed on
Oct 1, 1995
Bought by
Ball Bonnie Ruth
Create a Home Valuation Report for This Property
The Home Valuation Report is an in-depth analysis detailing your home's value as well as a comparison with similar homes in the area
Home Values in the Area
Average Home Value in this Area
Purchase History
| Date | Buyer | Sale Price | Title Company |
|---|---|---|---|
| Smith Scott | $80,000 | -- | |
| Wright Shay Kristin | $65,000 | -- | |
| Ball Bonnie | $47,000 | -- | |
| Community & Southern Bank | $55,000 | -- | |
| Dillard Phillip Les | $47,892 | -- | |
| Ball Bonnie Ruth | -- | -- |
Source: Public Records
Mortgage History
| Date | Status | Borrower | Loan Amount |
|---|---|---|---|
| Previous Owner | Wright Shay Kristin | $52,000 |
Source: Public Records
Tax History Compared to Growth
Tax History
| Year | Tax Paid | Tax Assessment Tax Assessment Total Assessment is a certain percentage of the fair market value that is determined by local assessors to be the total taxable value of land and additions on the property. | Land | Improvement |
|---|---|---|---|---|
| 2025 | $1,136 | $93,872 | $65,640 | $28,232 |
| 2024 | $1,136 | $73,348 | $50,120 | $23,228 |
| 2023 | $1,173 | $73,348 | $50,120 | $23,228 |
| 2022 | $1,171 | $66,520 | $49,000 | $17,520 |
| 2021 | $1,320 | $66,520 | $49,000 | $17,520 |
| 2020 | $671 | $30,520 | $14,760 | $15,760 |
| 2019 | $702 | $31,000 | $14,760 | $16,240 |
| 2018 | $596 | $31,000 | $14,760 | $16,240 |
| 2017 | $703 | $28,560 | $14,760 | $13,800 |
| 2016 | $727 | $28,960 | $14,760 | $14,200 |
| 2015 | $524 | $21,240 | $13,120 | $8,120 |
| 2014 | $466 | $21,400 | $13,120 | $8,280 |
| 2013 | -- | $28,520 | $13,120 | $15,400 |
Source: Public Records
Map
Nearby Homes
- 130 Cornett Dr
- 0 Call-Wright Rd Unit 3.54 ACRES
- 0 Call-Wright Rd Unit 417590
- 321 Call Wright Rd
- 0 Call-Wright Rd - 3 54 Acres
- 345 Oak Ridge Rd
- 850 Valley Dr
- 433 Valley Dr
- 1459 Ray Mountain Rd
- 28 Oak Ridge Way
- Lot 26 Oak Ridge Way
- Lot 6 Parkview Dr S
- Lots 6-8 Parkview Dr S
- 460 Back Pine Way
- 456 Back Pine Way
- TR 4 Old Northcutt Rd
- TR 2 Old Northcutt Rd
- 84 Logan St
- Lot 95 Cedar St
- Lot 95 Cedar St Unit 95
- 899 Old Highway 5 N
- 84 February Ln
- 107 Harper Rd
- 516 Cornett Dr
- 520 Cornett Dr
- 140 Cornett Dr
- 173 Harper Rd
- 00 Cornett Dr
- 000 Cornett Dr
- 0 Cornett Dr Unit 7 3201595
- 905 N Old Highway 5 N
- 138 February Ln
- 1004 Old Highway 5 N
- 144 February Ln
- 95 February Ln
- 95 February Ln
- 619 Old Highway 5 N
- 511 Harper Rd
- 17 AC Harper Rd
- LT 41 Harper Rd