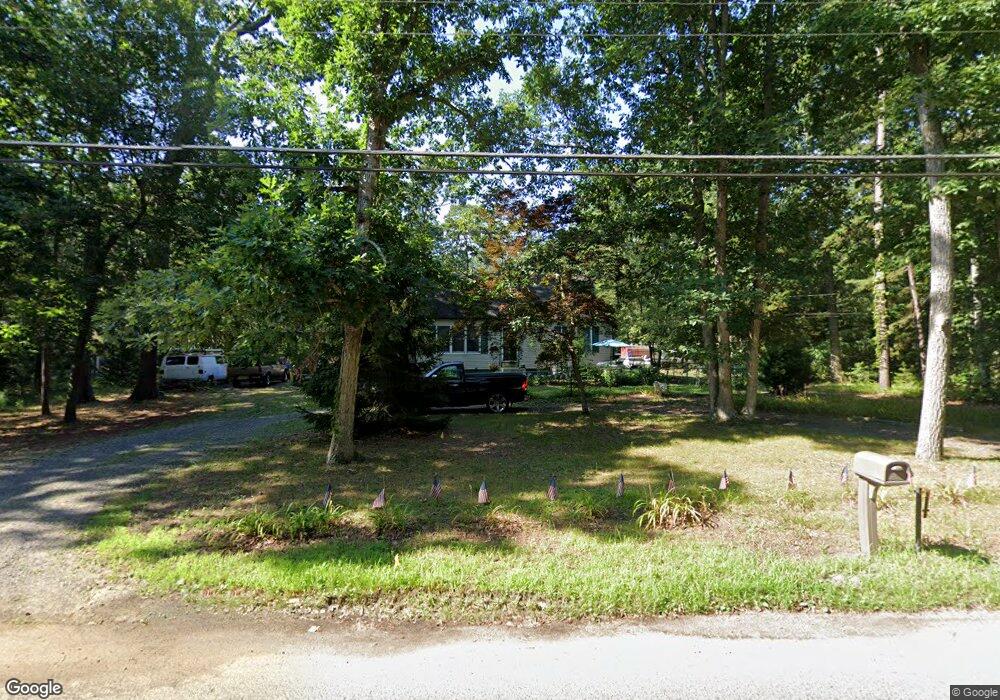
109 Hawkin Rd Tabernacle, NJ 08088
Estimated Value: $333,854 - $461,000
--
Bed
--
Bath
1,484
Sq Ft
$280/Sq Ft
Est. Value
About This Home
This home is located at 109 Hawkin Rd, Tabernacle, NJ 08088 and is currently estimated at $415,964, approximately $280 per square foot. 109 Hawkin Rd is a home located in Burlington County with nearby schools including Tabernacle Elementary School, Kenneth R Olson Mid School, and Seneca High School.
Ownership History
Date
Name
Owned For
Owner Type
Purchase Details
Closed on
Dec 12, 2002
Sold by
Mulvihill Terrence P and Mulvihill Dawn Marie
Bought by
Mulvihill Terrence P and Mulvihill Dawn Marie
Current Estimated Value
Home Financials for this Owner
Home Financials are based on the most recent Mortgage that was taken out on this home.
Original Mortgage
$148,000
Outstanding Balance
$62,841
Interest Rate
6.08%
Estimated Equity
$353,123
Purchase Details
Closed on
Aug 31, 1995
Sold by
Wasson James and Wasson Sharon E
Bought by
Mulvihill Terrence P and Graham Dawn Marie
Create a Home Valuation Report for This Property
The Home Valuation Report is an in-depth analysis detailing your home's value as well as a comparison with similar homes in the area
Home Values in the Area
Average Home Value in this Area
Purchase History
| Date | Buyer | Sale Price | Title Company |
|---|---|---|---|
| Mulvihill Terrence P | -- | -- | |
| Mulvihill Terrence P | $120,000 | -- |
Source: Public Records
Mortgage History
| Date | Status | Borrower | Loan Amount |
|---|---|---|---|
| Open | Mulvihill Terrence P | $148,000 |
Source: Public Records
Tax History Compared to Growth
Tax History
| Year | Tax Paid | Tax Assessment Tax Assessment Total Assessment is a certain percentage of the fair market value that is determined by local assessors to be the total taxable value of land and additions on the property. | Land | Improvement |
|---|---|---|---|---|
| 2025 | $5,634 | $170,100 | $68,000 | $102,100 |
| 2024 | $5,161 | $170,100 | $68,000 | $102,100 |
| 2023 | $5,161 | $170,100 | $68,000 | $102,100 |
| 2022 | $5,004 | $170,100 | $68,000 | $102,100 |
| 2021 | $5,093 | $170,100 | $68,000 | $102,100 |
| 2020 | $5,159 | $170,100 | $68,000 | $102,100 |
| 2019 | $5,004 | $170,100 | $68,000 | $102,100 |
| 2018 | $4,912 | $170,100 | $68,000 | $102,100 |
| 2017 | $4,882 | $170,100 | $68,000 | $102,100 |
| 2016 | $4,730 | $170,100 | $68,000 | $102,100 |
| 2015 | $4,690 | $170,100 | $68,000 | $102,100 |
| 2014 | $4,504 | $170,100 | $68,000 | $102,100 |
Source: Public Records
Map
Nearby Homes