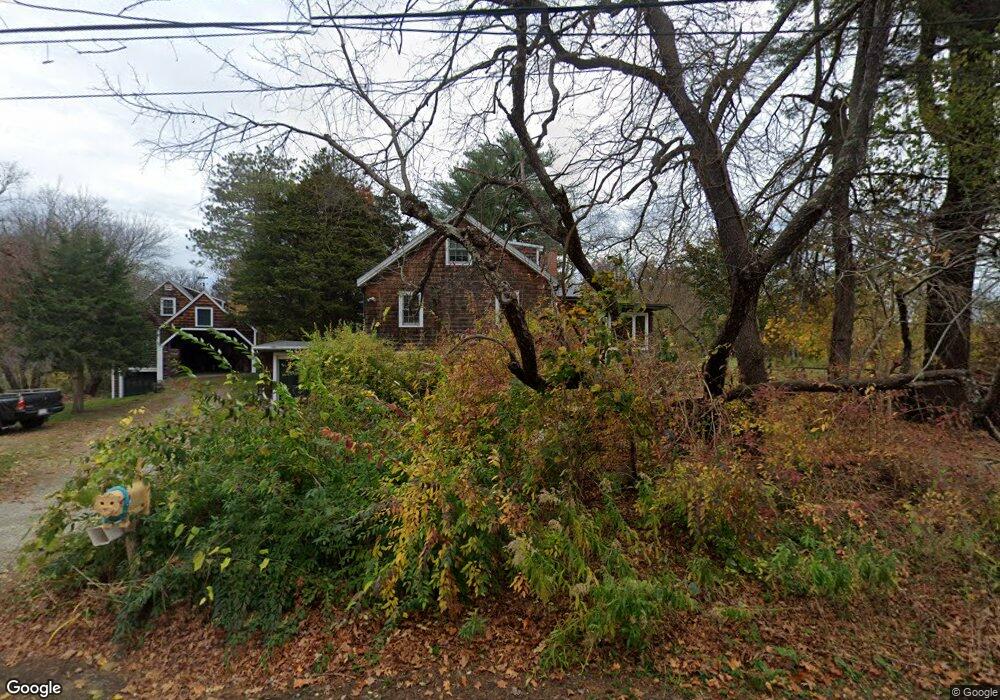
109 Hay St Newbury, MA 01951
Estimated Value: $627,000 - $782,000
2
Beds
1
Bath
1,024
Sq Ft
$690/Sq Ft
Est. Value
About This Home
This home is located at 109 Hay St, Newbury, MA 01951 and is currently estimated at $706,925, approximately $690 per square foot. 109 Hay St is a home located in Essex County with nearby schools including Triton Regional High School, River Valley Charter School, and Immaculate Conception School.
Ownership History
Date
Name
Owned For
Owner Type
Purchase Details
Closed on
Oct 9, 1987
Sold by
Perkins Mary F
Bought by
Webb David C
Current Estimated Value
Home Financials for this Owner
Home Financials are based on the most recent Mortgage that was taken out on this home.
Original Mortgage
$60,000
Interest Rate
10.33%
Mortgage Type
Purchase Money Mortgage
Create a Home Valuation Report for This Property
The Home Valuation Report is an in-depth analysis detailing your home's value as well as a comparison with similar homes in the area
Home Values in the Area
Average Home Value in this Area
Purchase History
| Date | Buyer | Sale Price | Title Company |
|---|---|---|---|
| Webb David C | $197,000 | -- |
Source: Public Records
Mortgage History
| Date | Status | Borrower | Loan Amount |
|---|---|---|---|
| Closed | Webb David C | $42,800 | |
| Closed | Webb David C | $30,000 | |
| Closed | Webb David C | $60,000 |
Source: Public Records
Tax History Compared to Growth
Tax History
| Year | Tax Paid | Tax Assessment Tax Assessment Total Assessment is a certain percentage of the fair market value that is determined by local assessors to be the total taxable value of land and additions on the property. | Land | Improvement |
|---|---|---|---|---|
| 2025 | $4,454 | $597,800 | $324,400 | $273,400 |
| 2024 | $4,495 | $585,300 | $324,400 | $260,900 |
| 2023 | $4,703 | $542,500 | $302,700 | $239,800 |
| 2022 | $4,585 | $471,200 | $259,500 | $211,700 |
| 2021 | $4,444 | $416,900 | $216,200 | $200,700 |
| 2020 | $4,519 | $411,200 | $216,200 | $195,000 |
| 2019 | $4,445 | $411,200 | $216,200 | $195,000 |
| 2018 | $4,260 | $390,800 | $209,800 | $181,000 |
| 2017 | $4,102 | $386,600 | $209,800 | $176,800 |
| 2016 | $4,251 | $372,900 | $194,600 | $178,300 |
| 2015 | $3,759 | $326,300 | $151,400 | $174,900 |
| 2014 | $3,571 | $315,500 | $140,600 | $174,900 |
Source: Public Records
Map
Nearby Homes