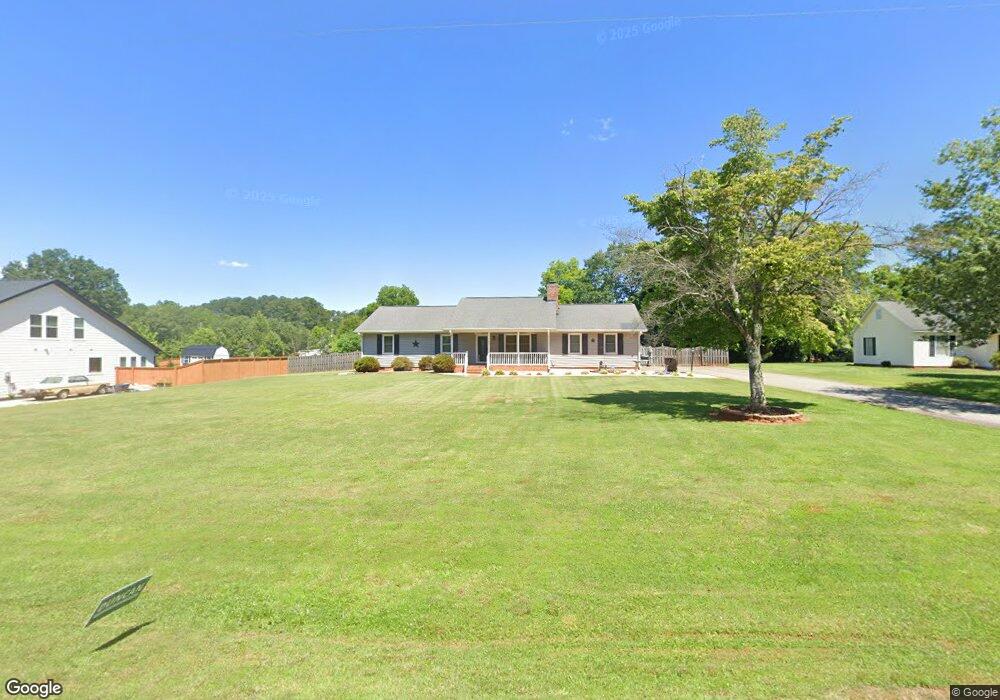
109 Holmes Dr Spartanburg, SC 29303
Estimated Value: $262,620 - $290,000
3
Beds
2
Baths
1,550
Sq Ft
$179/Sq Ft
Est. Value
About This Home
This home is located at 109 Holmes Dr, Spartanburg, SC 29303 and is currently estimated at $277,155, approximately $178 per square foot. 109 Holmes Dr is a home located in Spartanburg County with nearby schools including Dorman High School Freshman Campus, Dorman High School, and High Point Academy.
Ownership History
Date
Name
Owned For
Owner Type
Purchase Details
Closed on
Jan 7, 2021
Sold by
Hyder Brandon Chad and Estate Of Samuel Harrison Hyde
Bought by
Hyder Brandon Chad
Current Estimated Value
Purchase Details
Closed on
Feb 16, 2016
Sold by
Rosas Patricia
Bought by
Hyder Samuel H
Purchase Details
Closed on
Sep 11, 2015
Sold by
Rosas Patricia
Bought by
Hyder Samuel H and Rosas Patricia
Purchase Details
Closed on
Nov 6, 2006
Sold by
Rosas Guillermo
Bought by
Rosas Patricia
Purchase Details
Closed on
Mar 14, 2005
Sold by
Moore Marcus P and Moore Sandra D
Bought by
Rosas Guillermo and Rosas Patricia
Home Financials for this Owner
Home Financials are based on the most recent Mortgage that was taken out on this home.
Original Mortgage
$121,505
Interest Rate
5.54%
Mortgage Type
New Conventional
Create a Home Valuation Report for This Property
The Home Valuation Report is an in-depth analysis detailing your home's value as well as a comparison with similar homes in the area
Home Values in the Area
Average Home Value in this Area
Purchase History
| Date | Buyer | Sale Price | Title Company |
|---|---|---|---|
| Hyder Brandon Chad | -- | None Available | |
| Hyder Samuel H | -- | None Available | |
| Hyder Samuel H | -- | -- | |
| Rosas Patricia | -- | None Available | |
| Rosas Guillermo | $127,900 | -- |
Source: Public Records
Mortgage History
| Date | Status | Borrower | Loan Amount |
|---|---|---|---|
| Previous Owner | Rosas Guillermo | $121,505 |
Source: Public Records
Tax History Compared to Growth
Tax History
| Year | Tax Paid | Tax Assessment Tax Assessment Total Assessment is a certain percentage of the fair market value that is determined by local assessors to be the total taxable value of land and additions on the property. | Land | Improvement |
|---|---|---|---|---|
| 2025 | $1,121 | $6,367 | $517 | $5,850 |
| 2024 | $1,121 | $6,367 | $517 | $5,850 |
| 2023 | $1,121 | $6,367 | $517 | $5,850 |
| 2022 | $1,035 | $5,536 | $500 | $5,036 |
| 2021 | $975 | $5,536 | $500 | $5,036 |
| 2020 | $975 | $5,304 | $479 | $4,825 |
| 2019 | $975 | $5,304 | $479 | $4,825 |
| 2018 | $975 | $5,304 | $479 | $4,825 |
| 2017 | $845 | $4,612 | $500 | $4,112 |
| 2016 | $845 | $4,612 | $500 | $4,112 |
| 2015 | $833 | $4,612 | $500 | $4,112 |
| 2014 | $806 | $4,612 | $500 | $4,112 |
Source: Public Records
Map
Nearby Homes
- 238 Holmes Dr
- 10 Fort Prince Ct
- 1352 Hugh MacK Ct
- 1348 Hugh MacK Ct
- 1067 Cleveland Meadows Trail Unit CMD 296 Emerson B
- 1358 Hugh MacK Ct
- 1361 Hugh MacK Ct
- 1361 Hugh MacK Ct Unit CMD 379 Frost B
- 1358 Hugh MacK Ct Unit CMD 295 Crane C
- 1348 Hugh MacK Ct Unit CMD 294 Frost C
- 2114 Brechin Rd
- 1368 Hugh MacK Ct Unit CMD 298 Frost B
- 1368 Hugh MacK Ct
- 499 Valencia Cir
- 535 Valencia Cir
- 539 Valencia Cir
- 543 Valencia Cir
- 547 Valencia Cir
- 551 Valencia Cir
- 113 Holmes Dr
- 110 Holmes Dr
- 620 Mount Zion Rd
- 124 Holmes Dr
- 247 Holmes Dr
- 125 Holmes Dr
- 226 Holmes Dr
- 254 Holmes Dr
- 250 Holmes Dr
- 00 Mount Zion Rd
- 128 Holmes Dr
- 243 Holmes Dr
- 0 Holmes Dr Unit 242909
- 0 Holmes Dr Unit 1342717
- 0 Holmes Dr Unit 300941
- 0 Holmes Dr Unit 1499988
- 246 Holmes Dr
- 209 Holmes Dr
- 605 Mount Zion Rd
- 442 Mount Zion Rd