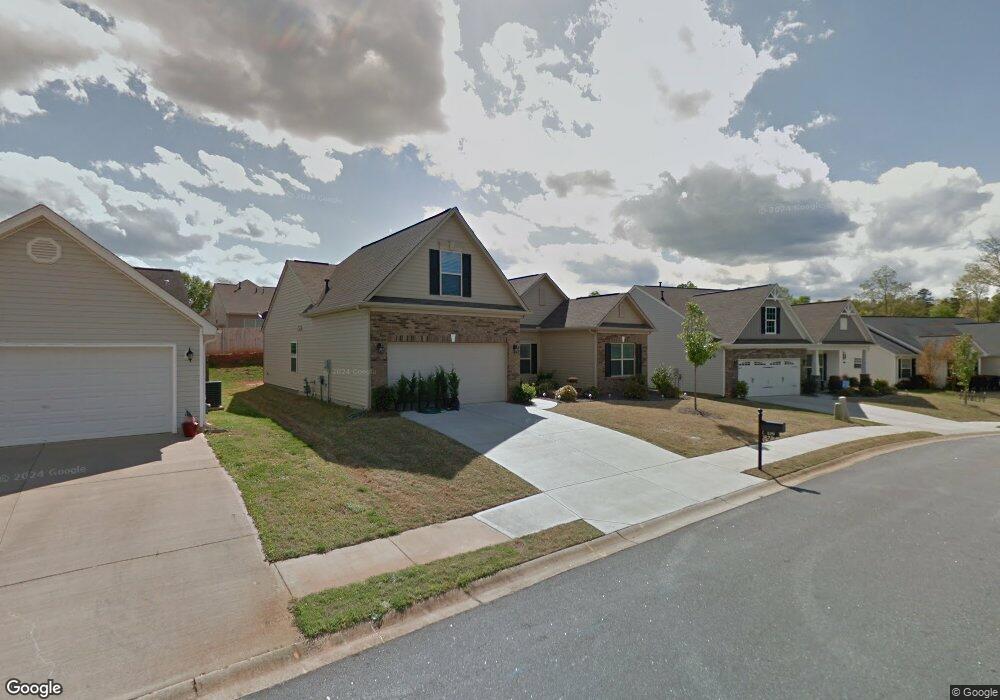
109 Ivy Trellis Ct Simpsonville, SC 29681
Estimated Value: $314,680 - $362,000
3
Beds
2
Baths
1,767
Sq Ft
$187/Sq Ft
Est. Value
About This Home
This home is located at 109 Ivy Trellis Ct, Simpsonville, SC 29681 and is currently estimated at $330,170, approximately $186 per square foot. 109 Ivy Trellis Ct is a home located in Greenville County with nearby schools including Bell's Crossing Elementary School, Hillcrest Middle School, and Hillcrest High School.
Ownership History
Date
Name
Owned For
Owner Type
Purchase Details
Closed on
Nov 27, 2018
Sold by
Chapman Felisa I
Bought by
Meyer Sallie A
Current Estimated Value
Home Financials for this Owner
Home Financials are based on the most recent Mortgage that was taken out on this home.
Original Mortgage
$148,750
Outstanding Balance
$131,052
Interest Rate
4.8%
Mortgage Type
New Conventional
Estimated Equity
$199,118
Purchase Details
Closed on
Mar 11, 2014
Sold by
Eastwood Construction Llc
Bought by
Chapman William C and Chapman Felisa I
Home Financials for this Owner
Home Financials are based on the most recent Mortgage that was taken out on this home.
Original Mortgage
$162,318
Interest Rate
4.35%
Mortgage Type
New Conventional
Purchase Details
Closed on
Mar 20, 2013
Sold by
Gray Realty & Development Inc
Bought by
Eastwood Construction Llc
Purchase Details
Closed on
Jan 8, 2013
Sold by
Brown Lake Properties Llc
Bought by
Gray Realty & Development Inc
Create a Home Valuation Report for This Property
The Home Valuation Report is an in-depth analysis detailing your home's value as well as a comparison with similar homes in the area
Home Values in the Area
Average Home Value in this Area
Purchase History
| Date | Buyer | Sale Price | Title Company |
|---|---|---|---|
| Meyer Sallie A | $175,000 | None Available | |
| Chapman William C | $170,861 | -- | |
| Eastwood Construction Llc | $185,000 | -- | |
| Gray Realty & Development Inc | $258,000 | -- |
Source: Public Records
Mortgage History
| Date | Status | Borrower | Loan Amount |
|---|---|---|---|
| Open | Meyer Sallie A | $148,750 | |
| Previous Owner | Chapman William C | $162,318 |
Source: Public Records
Tax History Compared to Growth
Tax History
| Year | Tax Paid | Tax Assessment Tax Assessment Total Assessment is a certain percentage of the fair market value that is determined by local assessors to be the total taxable value of land and additions on the property. | Land | Improvement |
|---|---|---|---|---|
| 2024 | $738 | $6,760 | $1,200 | $5,560 |
| 2023 | $738 | $6,760 | $1,200 | $5,560 |
| 2022 | $713 | $6,760 | $1,200 | $5,560 |
| 2021 | $702 | $6,760 | $1,200 | $5,560 |
| 2020 | $1,096 | $7,040 | $1,040 | $6,000 |
| 2019 | $1,079 | $7,040 | $1,040 | $6,000 |
| 2018 | $1,040 | $6,310 | $1,040 | $5,270 |
| 2017 | $737 | $6,310 | $1,040 | $5,270 |
| 2016 | $701 | $157,690 | $26,000 | $131,690 |
| 2015 | $701 | $157,690 | $26,000 | $131,690 |
| 2014 | $666 | $152,270 | $26,000 | $126,270 |
Source: Public Records
Map
Nearby Homes
- 5 Bathurst Ln
- 220 Waters Run Ln
- 108 Brown Ln
- 11 Manorwood Ct
- 409 Heather Falls Ln
- 135 Adams Creek Place
- 8 Ventana Ct
- 217 Lovelace Ct
- 10 Verona Cir
- 216 Ashcroft Ln
- 5 Grimes Dr
- 7 Bamburgh Brae Ct
- 117 Oak Valley Dr
- 103 Bedfordton Ct
- 4 Peyton Ln
- 2 Bamburgh Brae Ct
- 205 Allendale Abbey Ln
- 112 Dunrobin Ln
- 503 Lake Lennox Dr
- 401 Ashridge Way
- 105 Ivy Trellis Ct
- 113 Ivy Trellis Ct
- 10 Ivory Arch Ct
- 6 Ivory Arch Ct
- 14 Ivory Arch Ct
- 101 Ivy Trellis Ct
- 117 Ivy Trellis Ct
- 112 Ivy Trellis Ct
- 108 Ivy Trellis Ct
- 2 Ivory Arch Ct
- 18 Ivory Arch Ct
- 104 Ivy Trellis Ct
- 116 Ivy Trellis Ct
- 121 Ivy Trellis Ct
- 101 Alexan Dr
- 22 Ivory Arch Ct
- 100 Ivy Trellis Ct
- 15 Ivory Arch Ct
- 9 Ivory Arch Ct
- 19 Ivory Arch Ct