Estimated Value: $790,445 - $1,206,000
5
Beds
4
Baths
1,934
Sq Ft
$471/Sq Ft
Est. Value
About This Home
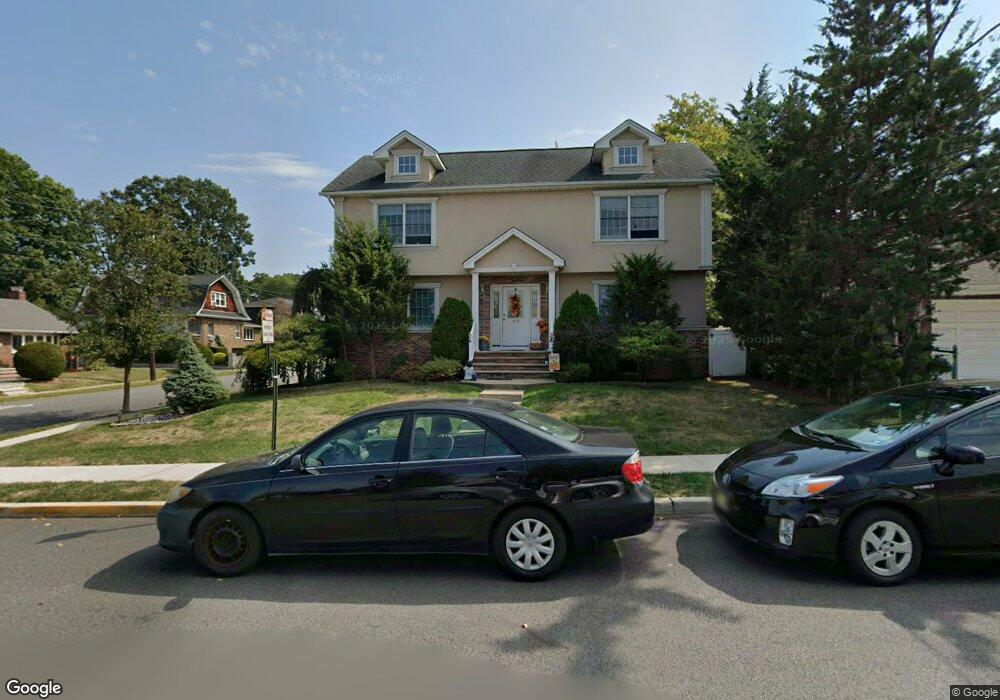
This home is located at 109 Jefferson Ave, Lodi, NJ 07644 and is currently estimated at $910,611, approximately $470 per square foot. 109 Jefferson Ave is a home located in Bergen County with nearby schools including Hilltop Elementary School, Thomas Jefferson Middle School, and Lodi High School.
Ownership History
Date
Name
Owned For
Owner Type
Purchase Details
Closed on
Oct 29, 2019
Sold by
Pimienta Pedro P and Vizhanay Ariana
Bought by
5214 Hudson Corp
Current Estimated Value
Purchase Details
Closed on
Nov 8, 2018
Sold by
Szymanski Janusz and Szymanski Kuprianowicz-Szymanski A
Bought by
Pimienta Pedro P and Vizhnay Ariana L
Purchase Details
Closed on
Apr 7, 2006
Sold by
Fifo Five Llc
Bought by
Szymanski Janusz and Szymanski Alixja Kupr
Home Financials for this Owner
Home Financials are based on the most recent Mortgage that was taken out on this home.
Original Mortgage
$550,000
Interest Rate
6.28%
Purchase Details
Closed on
Mar 30, 2005
Sold by
Batchelor Richard
Bought by
Fifo Five Llc
Purchase Details
Closed on
Aug 15, 1996
Sold by
Bonsignore Thedore
Bought by
Batchelor Richard and Batchelor Anna
Home Financials for this Owner
Home Financials are based on the most recent Mortgage that was taken out on this home.
Original Mortgage
$138,000
Interest Rate
8.08%
Mortgage Type
FHA
Create a Home Valuation Report for This Property
The Home Valuation Report is an in-depth analysis detailing your home's value as well as a comparison with similar homes in the area
Home Values in the Area
Average Home Value in this Area
Purchase History
| Date | Buyer | Sale Price | Title Company |
|---|---|---|---|
| 5214 Hudson Corp | $739,000 | None Available | |
| Pimienta Pedro P | $662,000 | -- | |
| Szymanski Janusz | $735,000 | -- | |
| Fifo Five Llc | $300,000 | -- | |
| Batchelor Richard | $142,000 | -- |
Source: Public Records
Mortgage History
| Date | Status | Borrower | Loan Amount |
|---|---|---|---|
| Previous Owner | Szymanski Janusz | $550,000 | |
| Previous Owner | Batchelor Richard | $138,000 |
Source: Public Records
Tax History Compared to Growth
Tax History
| Year | Tax Paid | Tax Assessment Tax Assessment Total Assessment is a certain percentage of the fair market value that is determined by local assessors to be the total taxable value of land and additions on the property. | Land | Improvement |
|---|---|---|---|---|
| 2025 | $17,933 | $535,000 | $167,300 | $367,700 |
| 2024 | $17,527 | $535,000 | $167,300 | $367,700 |
| 2023 | $17,462 | $535,000 | $167,300 | $367,700 |
| 2022 | $17,462 | $535,000 | $167,300 | $367,700 |
| 2021 | $17,682 | $535,000 | $167,300 | $367,700 |
| 2020 | $17,575 | $535,000 | $167,300 | $367,700 |
| 2019 | $17,334 | $535,000 | $167,300 | $367,700 |
| 2018 | $17,366 | $535,000 | $167,300 | $367,700 |
| 2017 | $17,345 | $535,000 | $167,300 | $367,700 |
| 2016 | $17,345 | $535,000 | $167,300 | $367,700 |
| 2015 | $17,136 | $535,000 | $167,300 | $367,700 |
| 2014 | $17,083 | $535,000 | $167,300 | $367,700 |
Source: Public Records
Map
Nearby Homes
- 95 Mckinley Ave
- 117 Central Ave Unit A
- 117 Central Ave
- 14 Jefferson Ave Unit 16
- 35 Franklin Ave
- 34 Lasalle Ave
- 74 Kipp Ave
- 111 Autumn St
- 116 Spring St
- 77 Chestnut St
- 212 Paterson Ave
- 149 Paterson Ave
- 144 S Main St
- 238 Bell Ave
- 252 Paterson Ave
- 85 Spring St
- 30 Woodside Ave
- 8800 Boulevard Unit 5F
- 8800 Boulevard Unit 7K
- 8800 Boulevard Unit 4B
- 40 Sheridan St
- 127 Kipp Ave
- 48 Sheridan Ave
- 41 Sheridan Ave
- 131 Kipp Ave
- 117 Kipp Ave
- 105 Jefferson Ave
- 49 Sheridan Ave
- 36 Sheridan Ave
- 137 Kipp Ave
- 29 Sheridan Ave
- 27 Sheridan Ave
- 59 Sheridan Ave
- 115 Kipp Ave
- 139 Kipp Ave
- 120 Kipp Ave
- 130A Kipp Ave Unit A
- 126 Kipp Ave
- 54 Monroe St
- 101 Jefferson Ave