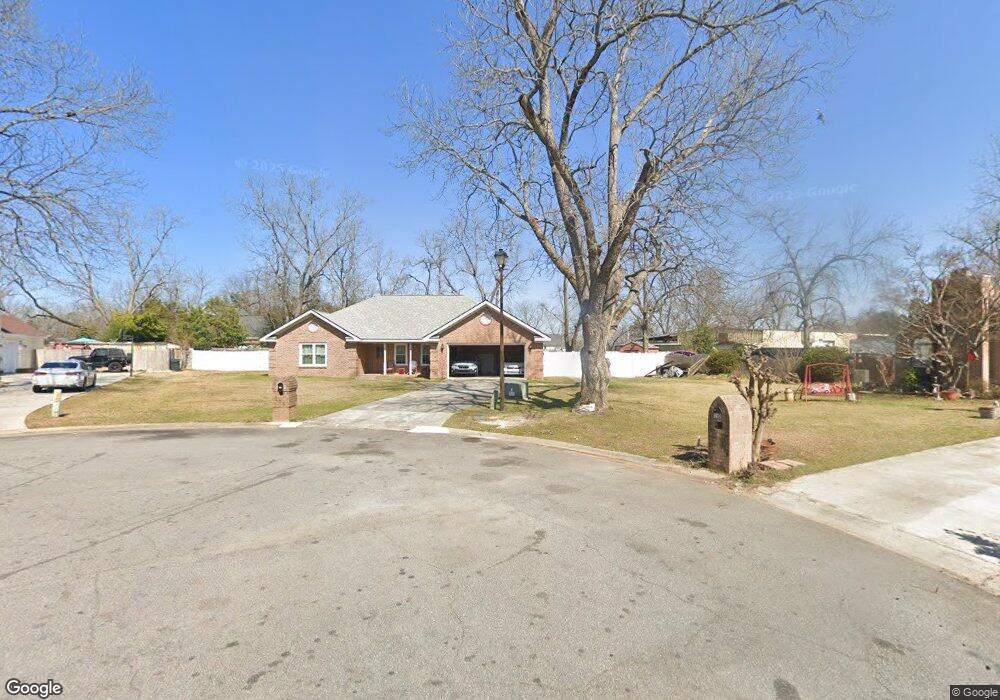
109 John Ct Warner Robins, GA 31093
Estimated Value: $282,000 - $328,000
4
Beds
2
Baths
2,490
Sq Ft
$122/Sq Ft
Est. Value
About This Home
This home is located at 109 John Ct, Warner Robins, GA 31093 and is currently estimated at $304,635, approximately $122 per square foot. 109 John Ct is a home located in Houston County with nearby schools including Northside Elementary School, Thomson Middle School, and Northside High School.
Ownership History
Date
Name
Owned For
Owner Type
Purchase Details
Closed on
Jun 29, 2009
Sold by
Walker Buford J
Bought by
Skeen James S and Skeen Tina M
Current Estimated Value
Home Financials for this Owner
Home Financials are based on the most recent Mortgage that was taken out on this home.
Original Mortgage
$165,000
Outstanding Balance
$104,794
Interest Rate
5.27%
Mortgage Type
VA
Estimated Equity
$199,841
Purchase Details
Closed on
Sep 26, 2002
Sold by
Trawick Richard C and Trawick Denise S
Bought by
Walker Buford J
Purchase Details
Closed on
May 3, 1991
Sold by
Harley Construction Co
Bought by
Trawick Richard C and Trawick Denise S
Purchase Details
Closed on
Aug 30, 1990
Bought by
Harley Construction Co
Create a Home Valuation Report for This Property
The Home Valuation Report is an in-depth analysis detailing your home's value as well as a comparison with similar homes in the area
Home Values in the Area
Average Home Value in this Area
Purchase History
| Date | Buyer | Sale Price | Title Company |
|---|---|---|---|
| Skeen James S | $165,000 | None Available | |
| Walker Buford J | $140,000 | -- | |
| Trawick Richard C | -- | -- | |
| Harley Construction Co | -- | -- |
Source: Public Records
Mortgage History
| Date | Status | Borrower | Loan Amount |
|---|---|---|---|
| Open | Skeen James S | $165,000 |
Source: Public Records
Tax History
| Year | Tax Paid | Tax Assessment Tax Assessment Total Assessment is a certain percentage of the fair market value that is determined by local assessors to be the total taxable value of land and additions on the property. | Land | Improvement |
|---|---|---|---|---|
| 2025 | -- | $110,480 | $12,800 | $97,680 |
| 2024 | -- | $104,240 | $11,000 | $93,240 |
| 2023 | $0 | $93,360 | $11,000 | $82,360 |
| 2022 | $1,734 | $71,760 | $8,200 | $63,560 |
| 2021 | $1,628 | $66,520 | $8,200 | $58,320 |
| 2020 | $1,626 | $66,440 | $8,200 | $58,240 |
| 2019 | $1,626 | $66,440 | $8,200 | $58,240 |
| 2018 | $0 | $66,440 | $8,200 | $58,240 |
| 2017 | $0 | $66,440 | $8,200 | $58,240 |
| 2016 | $201 | $66,440 | $8,200 | $58,240 |
| 2015 | -- | $66,440 | $8,200 | $58,240 |
| 2014 | -- | $66,440 | $8,200 | $58,240 |
| 2013 | -- | $66,440 | $8,200 | $58,240 |
Source: Public Records
Map
Nearby Homes
- 106 John Ct
- 4001 U S 41 Unit LOT 65
- 116 Majestic Trail
- 223 River Birch Way
- 113 Calpurnia St
- 205 River Birch Way
- 226 River Birch Way
- 106 Winged Elm Grove
- 133 Peach Rd
- 98 Coastal Dr
- 99 Bermuda Dr
- 214 Coastal Dr
- 211 Coastal Dr
- 312 Air View Dr Unit 7
- 310 Air View Dr Unit 6
- 304 Air View Dr Unit 3
- 304 Air View Dr
- 312 Air View Dr
- 310 Air View Dr
- 308 Air View Dr Unit 5
- 107 John Ct
- 105 Kathy Ln
- 110 John Ct
- 105 John Ct
- 1617 N Houston Lake Blvd
- 108 John Ct
- 106 Kathy Ln
- 103 Kathy Ln
- 104 John Ct
- 1705 N Houston Lake Blvd
- 103 John Ct
- 109 Wesley Way
- 111 Wesley Way
- 105 Silver Cir
- 104 Kathy Ln
- 107 Wesley Way
- 1613 N Houston Lake Blvd
- 102 John Ct
- 107 Silver Cir
- 113 Wesley Way
Your Personal Tour Guide
Ask me questions while you tour the home.