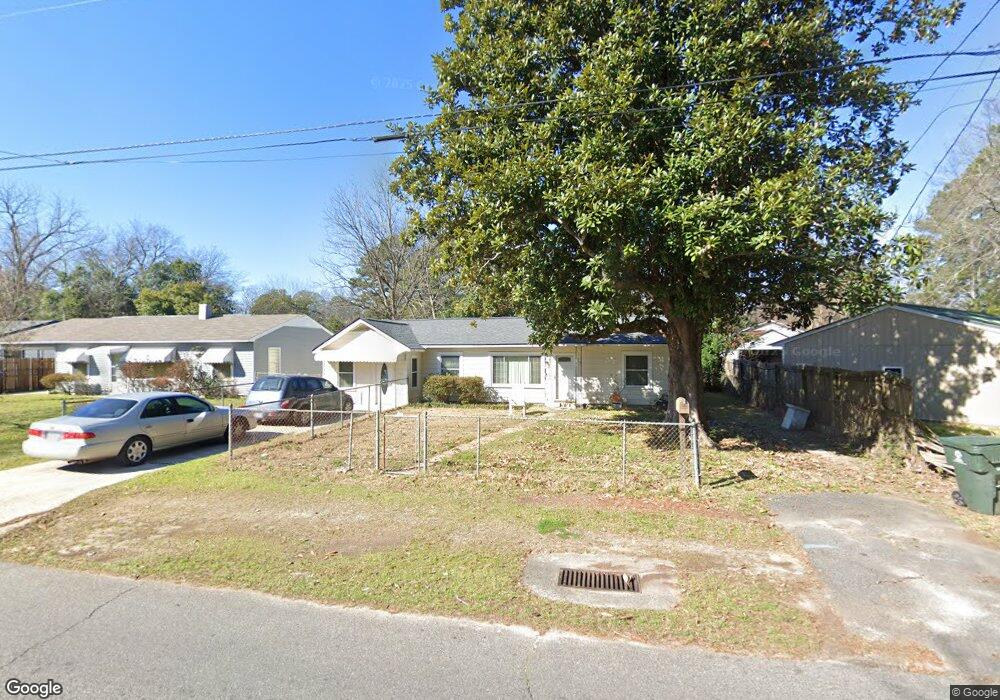
109 Johns Rd Warner Robins, GA 31093
Estimated Value: $113,000 - $134,000
3
Beds
2
Baths
1,740
Sq Ft
$72/Sq Ft
Est. Value
About This Home
This home is located at 109 Johns Rd, Warner Robins, GA 31093 and is currently estimated at $124,679, approximately $71 per square foot. 109 Johns Rd is a home located in Houston County with nearby schools including Parkwood Elementary School, Northside Middle School, and Northside High School.
Ownership History
Date
Name
Owned For
Owner Type
Purchase Details
Closed on
Mar 14, 2006
Sold by
Langston Mary L
Bought by
Thomas Cheryl D
Current Estimated Value
Purchase Details
Closed on
Apr 30, 2002
Sold by
Thomas Cheryl D
Bought by
Langston Mary L
Purchase Details
Closed on
Dec 7, 1989
Sold by
Howell Marie Collins
Bought by
Thomas Cheryl D
Purchase Details
Closed on
Dec 12, 1988
Bought by
Howell Marie Collins
Purchase Details
Closed on
Dec 8, 1988
Sold by
Howell Marie Collins
Bought by
Neale Glenn D and Neale Kathleen
Purchase Details
Closed on
Nov 24, 1986
Sold by
Collins William A
Bought by
Howell Marie Collins
Purchase Details
Closed on
Jun 28, 1962
Bought by
Collins William A
Create a Home Valuation Report for This Property
The Home Valuation Report is an in-depth analysis detailing your home's value as well as a comparison with similar homes in the area
Home Values in the Area
Average Home Value in this Area
Purchase History
| Date | Buyer | Sale Price | Title Company |
|---|---|---|---|
| Thomas Cheryl D | -- | None Available | |
| Langston Mary L | $55,000 | -- | |
| Thomas Cheryl D | -- | -- | |
| Howell Marie Collins | -- | -- | |
| Neale Glenn D | -- | -- | |
| Howell Marie Collins | -- | -- | |
| Collins William A | -- | -- | |
| Collins William A | -- | -- |
Source: Public Records
Tax History
| Year | Tax Paid | Tax Assessment Tax Assessment Total Assessment is a certain percentage of the fair market value that is determined by local assessors to be the total taxable value of land and additions on the property. | Land | Improvement |
|---|---|---|---|---|
| 2024 | $808 | $26,080 | $5,000 | $21,080 |
| 2023 | $649 | $19,680 | $2,160 | $17,520 |
| 2022 | $335 | $14,560 | $2,160 | $12,400 |
| 2021 | $290 | $12,560 | $2,160 | $10,400 |
| 2020 | $301 | $12,960 | $2,160 | $10,800 |
| 2019 | $301 | $12,960 | $2,160 | $10,800 |
| 2018 | $301 | $12,960 | $2,160 | $10,800 |
| 2017 | $301 | $12,960 | $2,160 | $10,800 |
| 2016 | $302 | $12,960 | $2,160 | $10,800 |
| 2015 | -- | $12,960 | $2,160 | $10,800 |
| 2014 | -- | $12,960 | $2,160 | $10,800 |
| 2013 | -- | $20,840 | $2,160 | $18,680 |
Source: Public Records
Map
Nearby Homes
- 239 Ward St
- 249 Ward St
- 212 Dunmurry Place
- 302 Dunmurry Place
- 714 Camellia Cir
- 108 Smith Place
- 100 Mauldon Ct
- 405 Dunmurry Place
- 300 Ward St
- 220 Francis St
- 437 Dunmurry Place
- 427 Alabama Ave
- 302 Hawaii Ave
- 423 Alabama Ave
- 102 Camellia Cir
- 102 Oregon Ct
- 213 Oklahoma Ave
- 422 Carolina Ave
- 220 Wendan Way
- 111 Wisconsin Ave
Your Personal Tour Guide
Ask me questions while you tour the home.