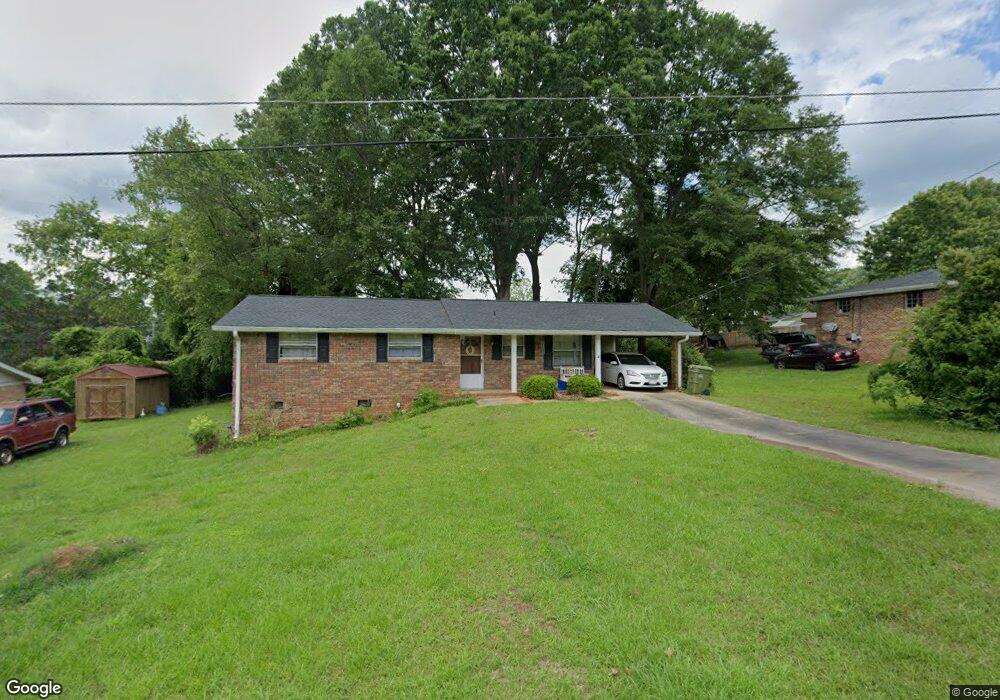
109 Kristy Ln Carrollton, GA 30117
Estimated Value: $128,000 - $209,000
3
Beds
1
Bath
1,008
Sq Ft
$182/Sq Ft
Est. Value
About This Home
This home is located at 109 Kristy Ln, Carrollton, GA 30117 and is currently estimated at $183,197, approximately $181 per square foot. 109 Kristy Ln is a home located in Carroll County with nearby schools including Carrollton Elementary School, Carrollton Upper Elementary School, and Carrollton Middle School.
Ownership History
Date
Name
Owned For
Owner Type
Purchase Details
Closed on
Sep 16, 2011
Sold by
Secretary Of Housing
Bought by
Obregon Anita S
Current Estimated Value
Home Financials for this Owner
Home Financials are based on the most recent Mortgage that was taken out on this home.
Original Mortgage
$25,721
Outstanding Balance
$17,814
Interest Rate
4.5%
Mortgage Type
FHA
Estimated Equity
$165,383
Purchase Details
Closed on
Apr 5, 2011
Sold by
Citimortgage Inc
Bought by
Sec Dept Of Housing
Purchase Details
Closed on
Mar 9, 2007
Sold by
Horsley Wayne F
Bought by
Mcnabb Michael S
Home Financials for this Owner
Home Financials are based on the most recent Mortgage that was taken out on this home.
Original Mortgage
$84,498
Interest Rate
6.22%
Mortgage Type
New Conventional
Purchase Details
Closed on
Dec 29, 1970
Sold by
Terry Homes Inc
Bought by
Horsely Wayne Franklin and Peggy Jean
Create a Home Valuation Report for This Property
The Home Valuation Report is an in-depth analysis detailing your home's value as well as a comparison with similar homes in the area
Home Values in the Area
Average Home Value in this Area
Purchase History
| Date | Buyer | Sale Price | Title Company |
|---|---|---|---|
| Obregon Anita S | $32,650 | -- | |
| Sec Dept Of Housing | $91,738 | -- | |
| Citimortgage Inc | $91,738 | -- | |
| Mcnabb Michael S | $92,500 | -- | |
| Horsely Wayne Franklin | -- | -- |
Source: Public Records
Mortgage History
| Date | Status | Borrower | Loan Amount |
|---|---|---|---|
| Open | Citimortgage Inc | $25,721 | |
| Previous Owner | Mcnabb Michael S | $84,498 |
Source: Public Records
Tax History Compared to Growth
Tax History
| Year | Tax Paid | Tax Assessment Tax Assessment Total Assessment is a certain percentage of the fair market value that is determined by local assessors to be the total taxable value of land and additions on the property. | Land | Improvement |
|---|---|---|---|---|
| 2024 | $245 | $47,288 | $6,000 | $41,288 |
| 2023 | $228 | $43,642 | $6,000 | $37,642 |
| 2022 | $223 | $36,256 | $6,000 | $30,256 |
| 2021 | $204 | $32,058 | $6,000 | $26,058 |
| 2020 | $192 | $29,312 | $6,000 | $23,312 |
| 2019 | $188 | $27,224 | $6,000 | $21,224 |
| 2018 | $184 | $25,231 | $6,000 | $19,231 |
| 2017 | $180 | $23,938 | $6,000 | $17,938 |
| 2016 | $181 | $23,938 | $6,000 | $17,938 |
| 2015 | $514 | $20,651 | $6,000 | $14,651 |
| 2014 | $517 | $20,651 | $6,000 | $14,651 |
Source: Public Records
Map
Nearby Homes
- 0 Carroll Cir Unit LOTS 4-8 10571562
- 403 Burns Rd
- 0 Burns Rd Unit LOT 2 10571612
- 0 Burns Rd Unit LOT 3 10571635
- 0 Burns Rd Unit LOT 1 10571595
- 0 Burns Rd Unit 148013
- 150 Cedar Park Way
- 204 Burns Rd
- 0 Carroll Cir- Lots 4-8 Unit 148012
- 3 Burns Rd
- 2 Burns Rd
- 8 Horsley Mill Rd
- 114 Green Point Way
- 9 Horsley Mill Rd
- 119 Oxford Square
- 208 Lane Dr
- 208 Lane Dr Unit LOT 62
- 223 N Lakeshore Dr
- 325 Almon Rd
- 231 N Lakeshore Dr
- 107 Kristy Ln
- 107 Kristy Ln Unit 91
- 111 Kristy Ln
- 112 Leigh Ln
- 114 Leigh Ln
- 110 Leigh Ln
- 110 Leigh Ln Unit 82
- 105 Kristy Ln
- 108 Kristy Ln
- 113 Kristy Ln
- 106 Kristy Ln
- 106 Kristy Ln
- 108 Leigh Ln
- 116 Leigh Ln
- 104 Kristy Ln Unit 216
- 104 Kristy Ln
- 103 Kristy Ln
- 112 Kristy Ln
- 0 Kristy Ln Unit 3250404
- 0 Kristy Ln Unit 7130470