Estimated Value: $592,000 - $615,000
3
Beds
3
Baths
2,160
Sq Ft
$281/Sq Ft
Est. Value
About This Home
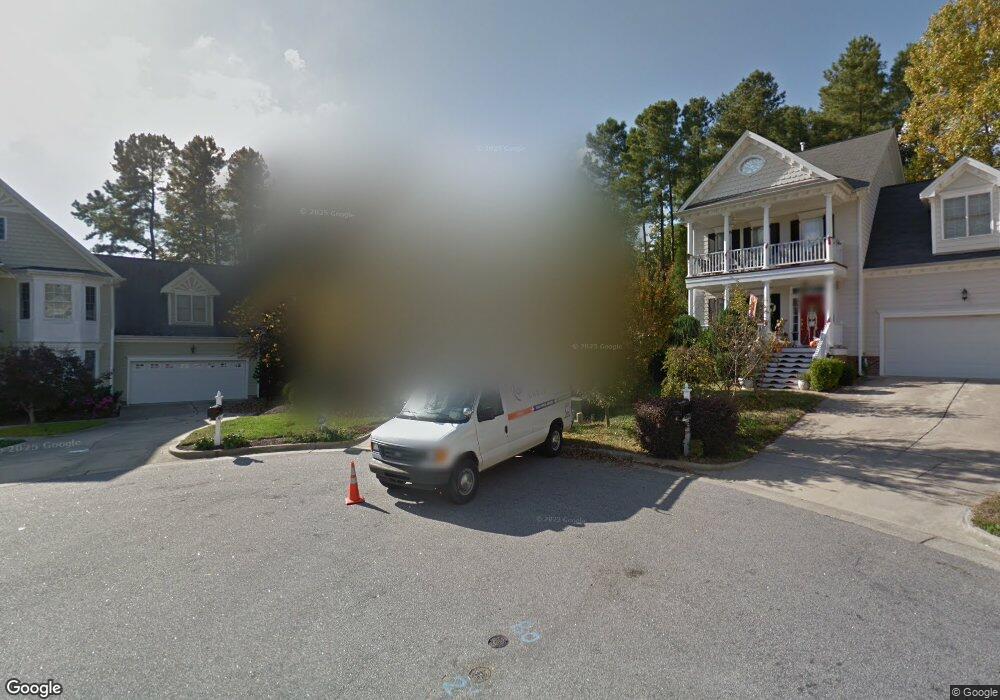
This home is located at 109 Kylesku Ct, Apex, NC 27502 and is currently estimated at $606,514, approximately $280 per square foot. 109 Kylesku Ct is a home located in Wake County with nearby schools including Scotts Ridge Elementary School, Apex Middle, and Apex High School.
Ownership History
Date
Name
Owned For
Owner Type
Purchase Details
Closed on
Feb 6, 2020
Sold by
Yaksic Heather Lynn
Bought by
Speerschneider Matthew and Yaksic Heather Lynn
Current Estimated Value
Purchase Details
Closed on
Jul 27, 2006
Sold by
Morrisey Stephen J
Bought by
Yaksic Heather Lynn
Home Financials for this Owner
Home Financials are based on the most recent Mortgage that was taken out on this home.
Original Mortgage
$41,235
Interest Rate
6.28%
Mortgage Type
Stand Alone Second
Purchase Details
Closed on
May 18, 2001
Sold by
Cattano Construction Inc
Bought by
Morrisey Stephen J
Home Financials for this Owner
Home Financials are based on the most recent Mortgage that was taken out on this home.
Original Mortgage
$180,800
Interest Rate
7.02%
Mortgage Type
Balloon
Create a Home Valuation Report for This Property
The Home Valuation Report is an in-depth analysis detailing your home's value as well as a comparison with similar homes in the area
Home Values in the Area
Average Home Value in this Area
Purchase History
| Date | Buyer | Sale Price | Title Company |
|---|---|---|---|
| Speerschneider Matthew | $182,000 | None Available | |
| Yaksic Heather Lynn | $275,000 | None Available | |
| Morrisey Stephen J | $226,000 | -- |
Source: Public Records
Mortgage History
| Date | Status | Borrower | Loan Amount |
|---|---|---|---|
| Previous Owner | Yaksic Heather Lynn | $41,235 | |
| Previous Owner | Yaksic Heather Lynn | $219,920 | |
| Previous Owner | Morrisey Stephen J | $180,800 | |
| Closed | Morrisey Stephen J | $22,600 |
Source: Public Records
Tax History Compared to Growth
Tax History
| Year | Tax Paid | Tax Assessment Tax Assessment Total Assessment is a certain percentage of the fair market value that is determined by local assessors to be the total taxable value of land and additions on the property. | Land | Improvement |
|---|---|---|---|---|
| 2025 | $4,927 | $561,976 | $180,000 | $381,976 |
| 2024 | $4,816 | $561,976 | $180,000 | $381,976 |
| 2023 | $3,998 | $362,616 | $73,000 | $289,616 |
| 2022 | $3,753 | $362,616 | $73,000 | $289,616 |
| 2021 | $3,610 | $362,616 | $73,000 | $289,616 |
| 2020 | $3,574 | $362,616 | $73,000 | $289,616 |
| 2019 | $3,454 | $302,367 | $73,000 | $229,367 |
| 2018 | $3,254 | $302,367 | $73,000 | $229,367 |
| 2017 | $3,029 | $302,367 | $73,000 | $229,367 |
| 2016 | $2,985 | $302,367 | $73,000 | $229,367 |
| 2015 | $2,919 | $288,602 | $68,000 | $220,602 |
| 2014 | $2,814 | $288,602 | $68,000 | $220,602 |
Source: Public Records
Map
Nearby Homes
- 541 Village Loop Dr
- 402 Village Loop Dr
- 1208 Tartarian Trail
- 209 Homegate Cir
- 1105 Capitata Crossing
- 0 Jb Morgan Rd Unit 10051948
- 103 Garden Side Way
- 1311 Pendula Path
- 2008 Silky Dogwood Trail
- 1116 Silky Dogwood Trail
- 441 Heritage Village Ln
- 3014 Silky Dogwood Trail
- 428 Heritage Village Ln
- 448 Heritage Village Ln
- 460 Heritage Village Ln
- 1773 Town Home Dr
- 104 Pine Tag Ct
- 1800 Pierre Place
- 1844 Woodall Crest Dr
- 1880 Woodall Crest Dr
- 108 Kylesku Ct
- 105 Kylesku Ct
- 524 Vatersay Dr
- 526 Vatersay Dr
- 522 Vatersay Dr
- 101 Kylesku Ct
- 520 Vatersay Dr
- 1721 White Dogwood Rd
- 1717 White Dogwood Rd
- 100 Kylesku Ct
- 1725 White Dogwood Rd
- 904 Town Side Dr
- 518 Vatersay Dr
- 1713 White Dogwood Rd
- 1729 White Dogwood Rd
- 525 Vatersay Dr
- 808 Town Side Dr
- 523 Vatersay Dr
- 813 Town Side Dr
- 521 Vatersay Dr