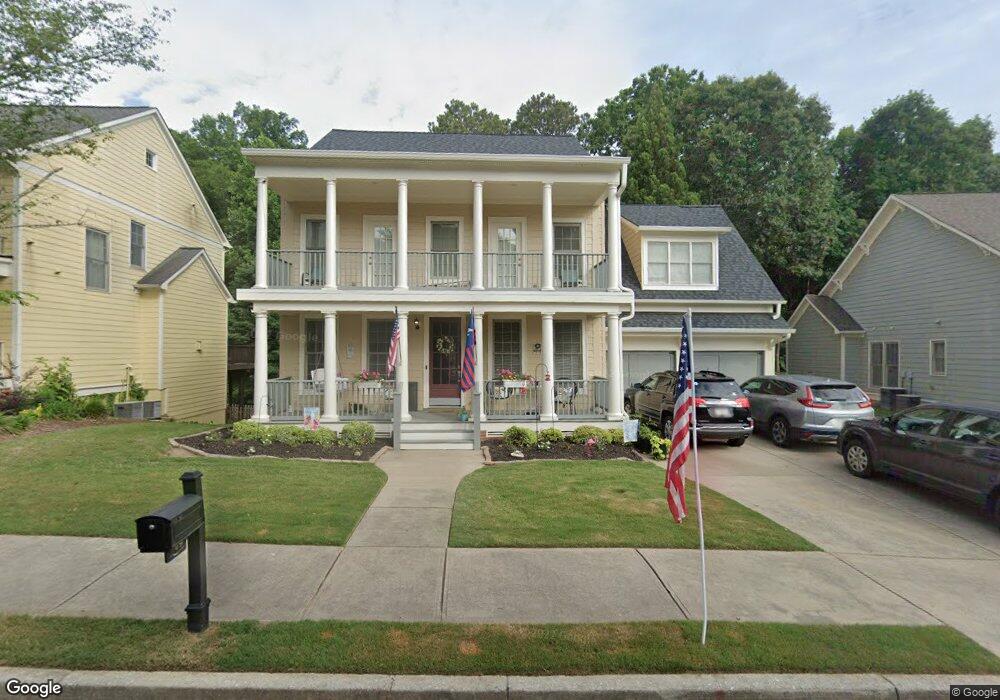
109 Laurel St Unit 109 Canton, GA 30114
Estimated Value: $579,000 - $594,425
5
Beds
4
Baths
3,982
Sq Ft
$147/Sq Ft
Est. Value
About This Home
This home is located at 109 Laurel St Unit 109, Canton, GA 30114 and is currently estimated at $586,713, approximately $147 per square foot. 109 Laurel St Unit 109 is a home located in Cherokee County with nearby schools including J. Knox Elementary School, Teasley Middle School, and Cherokee High School.
Ownership History
Date
Name
Owned For
Owner Type
Purchase Details
Closed on
Sep 11, 2023
Sold by
Bennett Cynthia D
Bought by
Bennett Cynthia D and Cavendish Chris
Current Estimated Value
Purchase Details
Closed on
Jun 21, 2021
Sold by
Washington Jurian J
Bought by
Bennett Cynthia D and Cavendish Erin
Home Financials for this Owner
Home Financials are based on the most recent Mortgage that was taken out on this home.
Original Mortgage
$300,162
Interest Rate
2.9%
Mortgage Type
FHA
Purchase Details
Closed on
Mar 30, 2017
Sold by
Carver Richard S
Bought by
Washington Jurian J and Washington Tamara B
Purchase Details
Closed on
Feb 17, 2006
Sold by
John Wieland Homes & Neighborh
Bought by
Carver Richard S
Home Financials for this Owner
Home Financials are based on the most recent Mortgage that was taken out on this home.
Original Mortgage
$240,100
Interest Rate
6.08%
Mortgage Type
New Conventional
Create a Home Valuation Report for This Property
The Home Valuation Report is an in-depth analysis detailing your home's value as well as a comparison with similar homes in the area
Home Values in the Area
Average Home Value in this Area
Purchase History
| Date | Buyer | Sale Price | Title Company |
|---|---|---|---|
| Bennett Cynthia D | -- | -- | |
| Bennett Cynthia D | $440,000 | -- | |
| Washington Jurian J | $285,000 | -- | |
| Carver Richard S | $300,200 | -- |
Source: Public Records
Mortgage History
| Date | Status | Borrower | Loan Amount |
|---|---|---|---|
| Previous Owner | Bennett Cynthia D | $300,162 | |
| Previous Owner | Carver Richard S | $240,100 |
Source: Public Records
Tax History Compared to Growth
Tax History
| Year | Tax Paid | Tax Assessment Tax Assessment Total Assessment is a certain percentage of the fair market value that is determined by local assessors to be the total taxable value of land and additions on the property. | Land | Improvement |
|---|---|---|---|---|
| 2025 | $1,187 | $217,840 | $40,000 | $177,840 |
| 2024 | $1,352 | $209,480 | $40,000 | $169,480 |
| 2023 | $1,021 | $208,720 | $40,000 | $168,720 |
| 2022 | $1,065 | $173,360 | $30,000 | $143,360 |
| 2021 | $4,163 | $142,040 | $24,400 | $117,640 |
| 2020 | $3,914 | $132,080 | $24,400 | $107,680 |
| 2019 | $3,826 | $128,480 | $24,400 | $104,080 |
| 2018 | $3,402 | $113,040 | $24,400 | $88,640 |
| 2017 | $2,742 | $280,200 | $22,400 | $89,680 |
| 2016 | $2,742 | $266,300 | $22,400 | $84,120 |
| 2015 | $2,543 | $244,900 | $22,400 | $75,560 |
| 2014 | $3,182 | $246,900 | $22,400 | $76,360 |
Source: Public Records
Map
Nearby Homes
- 108 Laurel St
- 993 Woodbury Rd
- 106 Woodbury Ln
- 135 Laurel St
- 425 Retreat Ln Unit K1
- 425 Retreat Ln
- 117 Market Ln
- 616 Parkview Dr
- 100 Academy Ln
- 150 Jaime Dr
- 203 Retreat Ln
- 312 Rampart St
- 314 Rampart St
- 315 N Rampart St
- 316 Rampart St
- 318 Rampart St
- 222 Patti Place
- 401 Murphy Ave
- 217 Village Overlook Unit H3
- 204 Village Overlook Unit J2