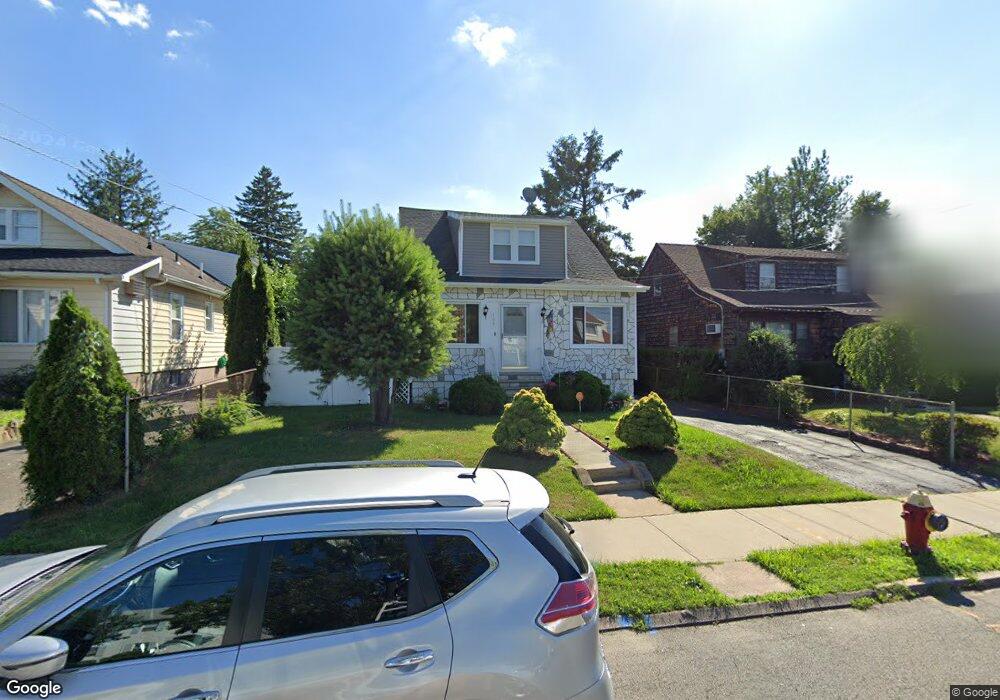
109 Lenox Ave Unit 111 Paterson, NJ 07502
Hillcrest NeighborhoodEstimated Value: $493,260 - $565,000
--
Bed
--
Bath
1,333
Sq Ft
$389/Sq Ft
Est. Value
About This Home
This home is located at 109 Lenox Ave Unit 111, Paterson, NJ 07502 and is currently estimated at $519,065, approximately $389 per square foot. 109 Lenox Ave Unit 111 is a home located in Passaic County with nearby schools including Edward W. Kilpatrick School of Discovery, Dale Avenue Elementary School, and Paterson Public School No. 5.
Ownership History
Date
Name
Owned For
Owner Type
Purchase Details
Closed on
Dec 11, 2011
Sold by
Torres Mario and Torres Sofia
Bought by
Morgan Bernard D and Morgan Chanese
Current Estimated Value
Home Financials for this Owner
Home Financials are based on the most recent Mortgage that was taken out on this home.
Original Mortgage
$204,020
Outstanding Balance
$141,952
Interest Rate
4.37%
Mortgage Type
FHA
Estimated Equity
$377,113
Purchase Details
Closed on
Nov 25, 2005
Sold by
Ortiz Mario R
Bought by
Torres Mario and Torres Juanita
Home Financials for this Owner
Home Financials are based on the most recent Mortgage that was taken out on this home.
Original Mortgage
$385,000
Interest Rate
6.34%
Purchase Details
Closed on
Aug 28, 1997
Sold by
Jaime Manuel and Jaime Martha
Bought by
Ortiz Mario R and Ortiz Maritza
Home Financials for this Owner
Home Financials are based on the most recent Mortgage that was taken out on this home.
Original Mortgage
$155,300
Interest Rate
7.47%
Mortgage Type
FHA
Create a Home Valuation Report for This Property
The Home Valuation Report is an in-depth analysis detailing your home's value as well as a comparison with similar homes in the area
Home Values in the Area
Average Home Value in this Area
Purchase History
| Date | Buyer | Sale Price | Title Company |
|---|---|---|---|
| Morgan Bernard D | $212,000 | -- | |
| Torres Mario | $385,000 | -- | |
| Ortiz Mario R | $158,500 | -- |
Source: Public Records
Mortgage History
| Date | Status | Borrower | Loan Amount |
|---|---|---|---|
| Open | Morgan Bernard D | $204,020 | |
| Previous Owner | Torres Mario | $385,000 | |
| Previous Owner | Ortiz Mario R | $155,300 |
Source: Public Records
Tax History Compared to Growth
Tax History
| Year | Tax Paid | Tax Assessment Tax Assessment Total Assessment is a certain percentage of the fair market value that is determined by local assessors to be the total taxable value of land and additions on the property. | Land | Improvement |
|---|---|---|---|---|
| 2025 | $10,878 | $213,500 | $83,800 | $129,700 |
| 2024 | $10,468 | $213,500 | $83,800 | $129,700 |
| 2022 | $9,911 | $213,500 | $83,800 | $129,700 |
| 2021 | $9,556 | $213,500 | $83,800 | $129,700 |
| 2020 | $8,914 | $213,500 | $83,800 | $129,700 |
| 2019 | $8,632 | $208,800 | $82,100 | $126,700 |
| 2018 | $8,912 | $206,000 | $81,300 | $124,700 |
| 2017 | $8,507 | $204,500 | $80,800 | $123,700 |
| 2016 | $8,847 | $203,900 | $85,000 | $118,900 |
| 2015 | $8,376 | $203,900 | $85,000 | $118,900 |
| 2014 | $7,531 | $259,700 | $128,800 | $130,900 |
Source: Public Records
Map
Nearby Homes
- 81 Berkshire Ave
- 153 Arlington Ave Unit 155
- 153 155arlington Ave
- 119 Burlington Ave Unit 121
- 119-121 Burlington Ave
- 120 Sherwood Ave Unit 102
- 32-34 Arlington Ave
- 28 Arlington Ave Unit 30
- 224 Union Ave
- 231 Lenox Ave Unit 233
- 231-233 Lenox Ave
- 203-207 Burlington Ave
- 239 Lexington Ave Unit 241
- 207 Burlington Ave
- 135 Elberon Ave Unit 137
- 249 Edmund Ave
- 29 Union Ave Unit 31
- 295-297 Linwood Ave
- 30 Union Ave Unit 32
- 194-196 Union Ave
- 105 Lenox Ave Unit 107
- 113 Lenox Ave Unit 115
- 101-103 Lenox Ave
- 117 Lenox Ave Unit 119
- 116 Lexington Ave Unit 118
- 120 Lexington Ave Unit 122
- 108 Lexington Ave Unit 114
- 110 Lenox Ave Unit 112
- 101 Lenox Ave Unit 103
- 92 Lexington Ave
- 124 Lexington Ave Unit 126
- 106-108 Lenox Ave
- 106 Lenox Ave Unit 108
- 121 Lenox Ave Unit 125
- 121-125 Lenox Ave
- 121 Lenox Ave Unit 1
- 114 Lenox Ave Unit 116
- 128 Lexington Ave Unit 134
- 97 Lenox Ave Unit 99
- 102 Lenox Ave Unit 104