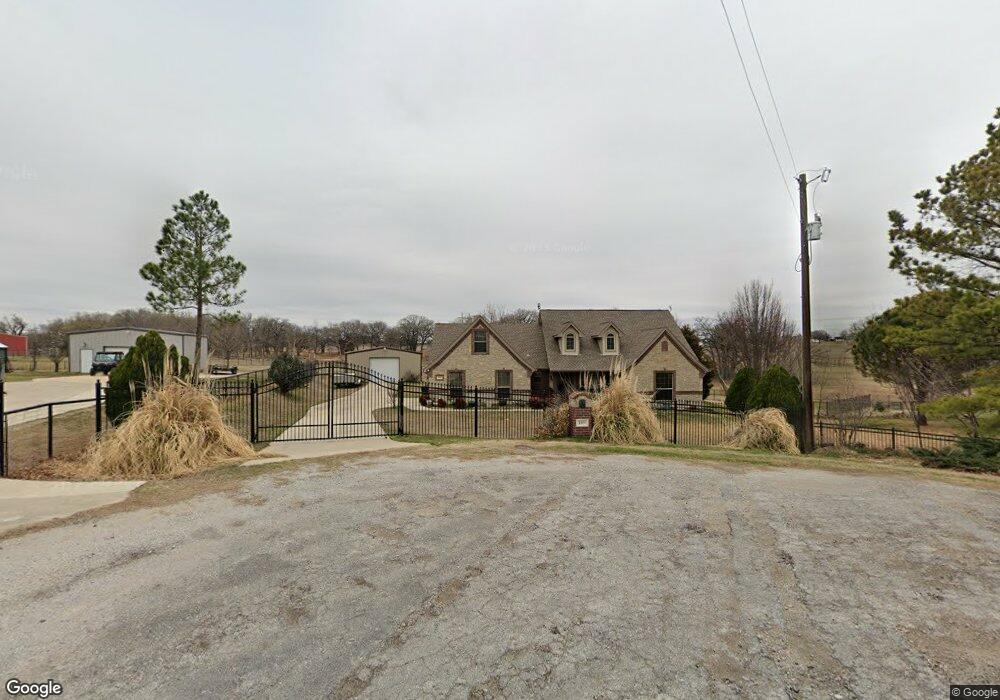
109 Lilly Ct Springtown, TX 76082
Estimated Value: $501,000 - $583,000
4
Beds
2
Baths
2,240
Sq Ft
$233/Sq Ft
Est. Value
About This Home
This home is located at 109 Lilly Ct, Springtown, TX 76082 and is currently estimated at $522,553, approximately $233 per square foot. 109 Lilly Ct is a home located in Parker County with nearby schools including Springtown Reno Elementary School, Springtown Intermediate School, and Springtown Middle School.
Ownership History
Date
Name
Owned For
Owner Type
Purchase Details
Closed on
Jun 27, 2013
Sold by
Morales Jose J and Morales Ivelisse
Bought by
Moon James Keith and Moon Marie R
Current Estimated Value
Home Financials for this Owner
Home Financials are based on the most recent Mortgage that was taken out on this home.
Original Mortgage
$274,783
Outstanding Balance
$196,679
Interest Rate
3.63%
Mortgage Type
VA
Estimated Equity
$325,874
Purchase Details
Closed on
Nov 21, 2008
Sold by
Cwe Investments Llc
Bought by
Moon James K and Moon Marie R
Purchase Details
Closed on
Jul 17, 2008
Sold by
Cottongame Investments Llc
Bought by
Moon James K and Moon Marie R
Purchase Details
Closed on
Jul 15, 2008
Sold by
Krc Estates Ltd
Bought by
Moon James K and Moon Marie R
Purchase Details
Closed on
Jul 10, 2007
Sold by
Rogers Carmen Christian Kathleen
Bought by
Moon James K and Moon Marie R
Purchase Details
Closed on
Jun 14, 2007
Sold by
Springfield W H
Bought by
Moon James K and Moon Marie R
Purchase Details
Closed on
May 1, 2007
Bought by
Moon James K and Moon Marie R
Purchase Details
Closed on
Jul 18, 2005
Bought by
Moon James K and Moon Marie R
Create a Home Valuation Report for This Property
The Home Valuation Report is an in-depth analysis detailing your home's value as well as a comparison with similar homes in the area
Home Values in the Area
Average Home Value in this Area
Purchase History
We collect this data history from publicly available records. To have your information removed, we recommend requesting removal directly through your county’s website.
| Date | Buyer | Sale Price | Title Company |
|---|---|---|---|
| Moon James Keith | -- | Fnt | |
| Moon James K | -- | -- | |
| Morales Jose J | -- | Fnt | |
| Moon James K | -- | -- | |
| Moon James K | -- | -- | |
| Moon James K | -- | -- | |
| Moon James K | -- | -- | |
| Moon James K | -- | -- | |
| Moon James K | -- | -- |
Source: Public Records
Mortgage History
We collect this data history from publicly available records. To have your information removed, we recommend requesting removal directly through your county’s website.
| Date | Status | Borrower | Loan Amount |
|---|---|---|---|
| Open | Moon James Keith | $274,783 |
Source: Public Records
Tax History
| Year | Tax Paid | Tax Assessment Tax Assessment Total Assessment is a certain percentage of the fair market value that is determined by local assessors to be the total taxable value of land and additions on the property. | Land | Improvement |
|---|---|---|---|---|
| 2025 | $3,282 | $477,905 | $130,690 | $347,215 |
| 2024 | $3,282 | $531,480 | $130,690 | $400,790 |
| 2023 | $3,282 | $531,480 | $130,690 | $400,790 |
| 2022 | $7,573 | $352,040 | $70,000 | $282,040 |
| 2021 | $8,293 | $352,040 | $70,000 | $282,040 |
| 2020 | $7,113 | $302,780 | $55,000 | $247,780 |
| 2019 | $7,551 | $302,780 | $55,000 | $247,780 |
| 2018 | $6,656 | $266,230 | $40,000 | $226,230 |
| 2017 | $6,948 | $266,230 | $40,000 | $226,230 |
| 2016 | $6,432 | $246,490 | $35,000 | $211,490 |
| 2015 | $5,053 | $246,490 | $35,000 | $211,490 |
| 2014 | $5,244 | $203,750 | $35,000 | $168,750 |
Source: Public Records
Map
Nearby Homes
- 3559 Springfield Rd
- 3420 Springfield Rd
- 3601 Springfield Rd
- 1020 Jesse James Ln
- 306 Garden Ct
- 2553 E Highway 199
- 3737 E Highway 199
- 328 Creekview Meadows Dr
- 144 Oak Meadows Dr
- 303 New Highland Rd
- 206 Creekview Meadows Ct
- 2400 Springfield Rd
- 150 Oak Valley Ln
- 220 Country Side Ct
- 4861 E Highway 199
- 1085 Highland Cir
- 1012 Vista Hills Dr
- 1035 Northern Oaks Ct
- 5066 E Highway 199
- 134 Classic Country Ct
Your Personal Tour Guide
Ask me questions while you tour the home.