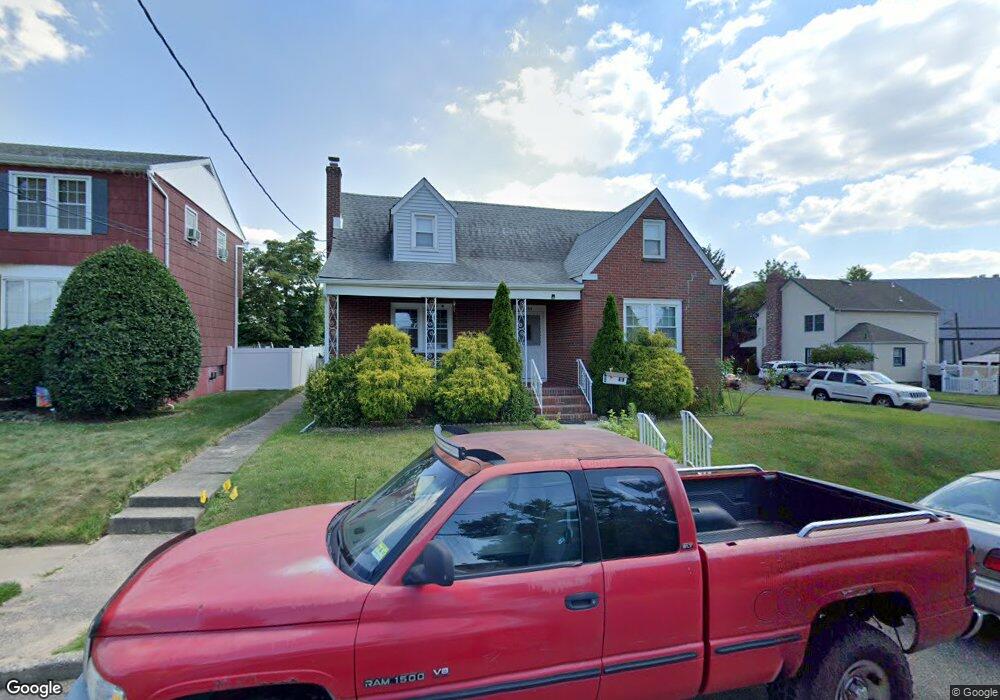
109 Loretta St Perth Amboy, NJ 08861
Estimated Value: $407,616 - $533,000
4
Beds
2
Baths
1,397
Sq Ft
$350/Sq Ft
Est. Value
About This Home
This home is located at 109 Loretta St, Perth Amboy, NJ 08861 and is currently estimated at $488,404, approximately $349 per square foot. 109 Loretta St is a home located in Middlesex County with nearby schools including Port Reading Elementary School, Fords Middle School, and John F. Kennedy Memorial High School.
Ownership History
Date
Name
Owned For
Owner Type
Purchase Details
Closed on
Jul 25, 2017
Sold by
Parker Dorothea C
Bought by
Hernandez Roberto M Duran and Duran Johanna J Garcia De
Current Estimated Value
Home Financials for this Owner
Home Financials are based on the most recent Mortgage that was taken out on this home.
Original Mortgage
$260,022
Outstanding Balance
$215,915
Interest Rate
3.87%
Mortgage Type
FHA
Estimated Equity
$272,489
Purchase Details
Closed on
Aug 2, 2012
Sold by
Pakla Mary and Leithauser Darlene
Bought by
Parker Dorothea C
Create a Home Valuation Report for This Property
The Home Valuation Report is an in-depth analysis detailing your home's value as well as a comparison with similar homes in the area
Home Values in the Area
Average Home Value in this Area
Purchase History
| Date | Buyer | Sale Price | Title Company |
|---|---|---|---|
| Hernandez Roberto M Duran | $265,000 | Foundation Title Llc | |
| Parker Dorothea C | $247,000 | None Available |
Source: Public Records
Mortgage History
| Date | Status | Borrower | Loan Amount |
|---|---|---|---|
| Open | Hernandez Roberto M Duran | $260,022 |
Source: Public Records
Tax History Compared to Growth
Tax History
| Year | Tax Paid | Tax Assessment Tax Assessment Total Assessment is a certain percentage of the fair market value that is determined by local assessors to be the total taxable value of land and additions on the property. | Land | Improvement |
|---|---|---|---|---|
| 2025 | $9,656 | $76,100 | $22,800 | $53,300 |
| 2024 | $9,414 | $76,100 | $22,800 | $53,300 |
| 2023 | $9,414 | $76,100 | $22,800 | $53,300 |
| 2022 | $9,143 | $76,100 | $22,800 | $53,300 |
| 2021 | $9,140 | $76,100 | $22,800 | $53,300 |
| 2020 | $8,824 | $76,100 | $22,800 | $53,300 |
| 2019 | $8,611 | $76,100 | $22,800 | $53,300 |
| 2018 | $8,417 | $76,100 | $22,800 | $53,300 |
| 2017 | $8,261 | $76,100 | $22,800 | $53,300 |
| 2016 | $8,178 | $76,100 | $22,800 | $53,300 |
| 2015 | $8,031 | $76,100 | $22,800 | $53,300 |
| 2014 | $7,820 | $76,100 | $22,800 | $53,300 |
Source: Public Records
Map
Nearby Homes
- 71 Pennsylvania Ave
- 164 Pennsylvania Ave
- 49 Loretta St
- 133 Howard St
- 16 Emmett Ave
- 6 Worden Ave
- 29 S Columbus Ave
- 59 Douglas St
- 12 Liberty St
- 490 Mckeon St
- 1 Olive St
- 670 Columbus Cir
- 99 Crestview Rd
- 111 Longview Cir
- 21 Douglas St
- 685 Raritan Ave
- 693 Hanson Ave
- 450 Crows Mill Rd
- 47 Harned Ave
- 773 Colgate Ave