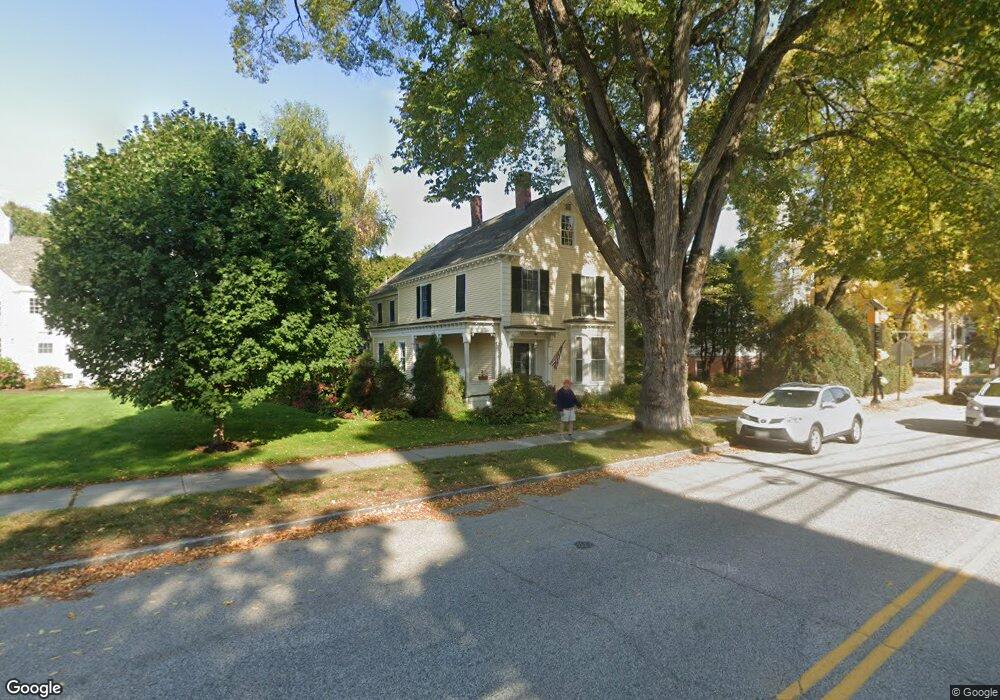
109 Main St Yarmouth, ME 04096
Estimated Value: $1,170,000 - $1,614,980
3
Beds
5
Baths
4,214
Sq Ft
$351/Sq Ft
Est. Value
About This Home
This home is located at 109 Main St, Yarmouth, ME 04096 and is currently estimated at $1,477,995, approximately $350 per square foot. 109 Main St is a home located in Cumberland County with nearby schools including William H. Rowe School, Yarmouth Elementary School, and Frank H. Harrison Middle School.
Ownership History
Date
Name
Owned For
Owner Type
Purchase Details
Closed on
Sep 12, 2024
Sold by
Sedgewick John E and Keefe Deborah A
Bought by
Sedgewick John E and Keefe Deborah A
Current Estimated Value
Purchase Details
Closed on
Aug 2, 2024
Sold by
Yellow Pine Llc
Bought by
362 West Main St Llc
Purchase Details
Closed on
Jul 12, 2006
Sold by
Vitalius Robert E and Vitalius Maryanne R
Bought by
Sedgewick John E and Keefe Deborah A
Home Financials for this Owner
Home Financials are based on the most recent Mortgage that was taken out on this home.
Original Mortgage
$400,000
Interest Rate
6.71%
Mortgage Type
Purchase Money Mortgage
Create a Home Valuation Report for This Property
The Home Valuation Report is an in-depth analysis detailing your home's value as well as a comparison with similar homes in the area
Home Values in the Area
Average Home Value in this Area
Purchase History
| Date | Buyer | Sale Price | Title Company |
|---|---|---|---|
| Sedgewick John E | -- | None Available | |
| Sedgewick John E | -- | None Available | |
| 362 West Main St Llc | -- | None Available | |
| 362 West Main St Llc | -- | None Available | |
| Sedgewick John E | -- | -- | |
| Sedgewick John E | -- | -- | |
| Sedgewick John E | -- | -- |
Source: Public Records
Mortgage History
| Date | Status | Borrower | Loan Amount |
|---|---|---|---|
| Previous Owner | Sedgewick John E | $417,000 | |
| Previous Owner | Sedgewick John E | $400,000 |
Source: Public Records
Tax History Compared to Growth
Tax History
| Year | Tax Paid | Tax Assessment Tax Assessment Total Assessment is a certain percentage of the fair market value that is determined by local assessors to be the total taxable value of land and additions on the property. | Land | Improvement |
|---|---|---|---|---|
| 2024 | $20,323 | $791,700 | $195,100 | $596,600 |
| 2023 | $18,637 | $791,700 | $195,100 | $596,600 |
| 2022 | $17,117 | $791,700 | $195,100 | $596,600 |
| 2021 | $15,230 | $791,700 | $195,100 | $596,600 |
| 2020 | $14,854 | $782,100 | $195,100 | $587,000 |
| 2019 | $14,750 | $782,100 | $195,100 | $587,000 |
| 2018 | $13,921 | $782,100 | $195,100 | $587,000 |
| 2017 | $13,421 | $782,100 | $195,100 | $587,000 |
| 2016 | $1,339 | $782,100 | $195,100 | $587,000 |
| 2015 | $10,435 | $484,000 | $119,400 | $364,600 |
| 2014 | $10,454 | $484,000 | $119,400 | $364,600 |
| 2013 | $10,648 | $484,000 | $0 | $0 |
Source: Public Records
Map
Nearby Homes
- 70 Main St
- 69 Rand Rd
- 51 Pleasant St
- 1 Railroad Square Unit Townhome C
- 1 Railroad Square Unit 103
- 1 Railroad Square Unit 205
- 1 Railroad Square Unit 305
- 1 Railroad Square Unit 403
- 1 Railroad Square Unit 101
- 149 E Main St Unit 7
- 309 Main St Unit A
- 86 Pleasant St
- 0 Bayview St
- 37 South St
- 3 Cumberland St
- 69 Gail Ln
- 62 Blueberry Cove Rd Unit 62
- 44 Ellen Cir
- 52 Blueberry Cove Rd Unit 52
- 30 Blueberry Cove