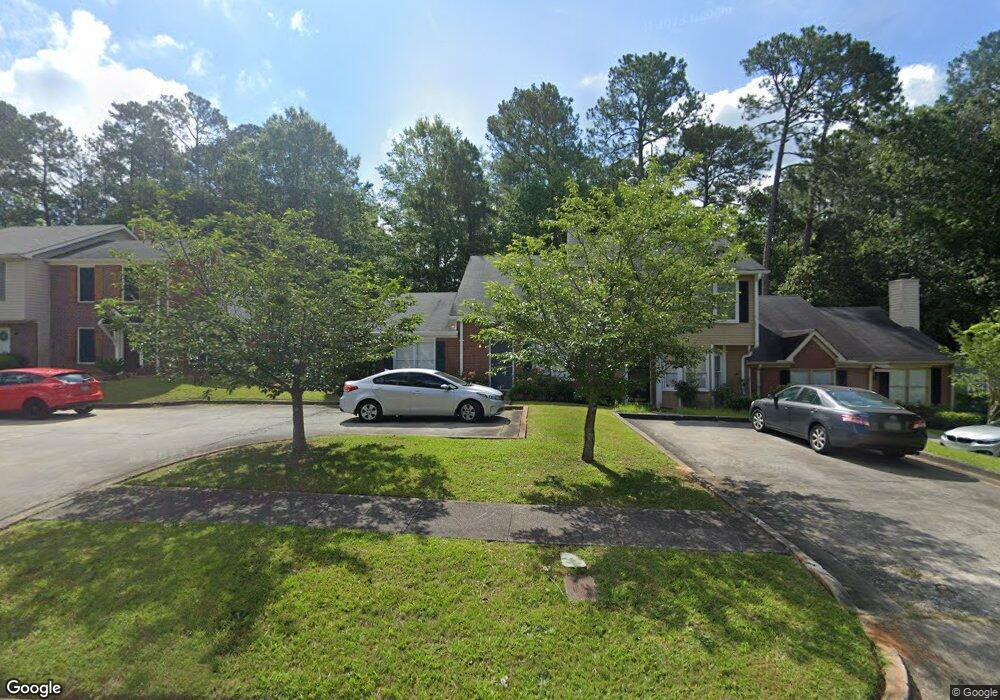
109 Manor Row Macon, GA 31210
Estimated Value: $134,455 - $170,000
2
Beds
2
Baths
850
Sq Ft
$174/Sq Ft
Est. Value
About This Home
This home is located at 109 Manor Row, Macon, GA 31210 and is currently estimated at $148,114, approximately $174 per square foot. 109 Manor Row is a home located in Bibb County with nearby schools including Carter Elementary School, Howard Middle School, and Howard High School.
Ownership History
Date
Name
Owned For
Owner Type
Purchase Details
Closed on
Nov 4, 2022
Sold by
Colley Sharon E
Bought by
Sharon Elizabeth Colley Trustee Of The Sec Tr
Current Estimated Value
Purchase Details
Closed on
Mar 20, 2009
Sold by
Kozojed Sharon Elaine Moore
Bought by
Colley Sharon E
Home Financials for this Owner
Home Financials are based on the most recent Mortgage that was taken out on this home.
Original Mortgage
$92,287
Interest Rate
5.29%
Mortgage Type
FHA
Create a Home Valuation Report for This Property
The Home Valuation Report is an in-depth analysis detailing your home's value as well as a comparison with similar homes in the area
Purchase History
| Date | Buyer | Sale Price | Title Company |
|---|---|---|---|
| Sharon Elizabeth Colley Trustee Of The Sec Tr | -- | -- | |
| Colley Sharon E | $94,000 | None Available |
Source: Public Records
Mortgage History
| Date | Status | Borrower | Loan Amount |
|---|---|---|---|
| Previous Owner | Colley Sharon E | $92,287 |
Source: Public Records
Tax History
| Year | Tax Paid | Tax Assessment Tax Assessment Total Assessment is a certain percentage of the fair market value that is determined by local assessors to be the total taxable value of land and additions on the property. | Land | Improvement |
|---|---|---|---|---|
| 2025 | $949 | $45,626 | $8,000 | $37,626 |
| 2024 | $840 | $40,081 | $8,000 | $32,081 |
| 2023 | $277 | $35,922 | $8,000 | $27,922 |
| 2022 | $984 | $35,416 | $5,280 | $30,136 |
| 2021 | $942 | $31,800 | $5,280 | $26,520 |
| 2020 | $916 | $30,595 | $5,280 | $25,315 |
| 2019 | $924 | $30,595 | $5,280 | $25,315 |
| 2018 | $1,522 | $29,389 | $5,280 | $24,109 |
| 2017 | $731 | $26,498 | $4,800 | $21,698 |
| 2016 | $675 | $26,498 | $4,800 | $21,698 |
| 2015 | $1,265 | $32,820 | $6,300 | $26,520 |
| 2014 | $1,267 | $32,820 | $6,300 | $26,520 |
Source: Public Records
Map
Nearby Homes
- 113 Manor Row
- 108 Manor Terrace
- 173 Sanders Rd
- 5181 Zebulon Rd
- 107 Clarksville Ct
- 111 the Vinings
- 5133 Oaktree Dr
- 5056 Wellington Dr
- 4922 Brittany Dr
- 140 Senora Place
- 175 Rivoli Landing
- 4923 Rivoli Dr Unit E
- 5104 Pine Ridge Dr
- 5256 Rivoli Dr
- 181 Rivoli Landing
- 4978 Wellington Dr
- 131 Ashford Park
- 100 Trillium Terrace
- 103 Howard Oaks Dr
- 4860 Forsyth Rd
Your Personal Tour Guide
Ask me questions while you tour the home.